Basics of Pharo Environment
In this short guide we will teach you how to use navigate the Pharo environment and use 4 main tools: Playground, Inspector, System Browser, and Debugger. We will also teach you how to search for methods and classes with Spotter and how to browse implementors and senders of different methods and classes.
TL;DR Useful Shortcuts
Here is the table of keyboard shortcuts that will be presented in this section:
| Action | Windows and Linux | Mac |
|---|---|---|
| Do-it (execute selected piece of code) | Ctrl+D | Cmd+D |
| Print-it (execute selected code and print the result) | Ctrl+P | Cmd+P |
| Inspect-it (execute selected code and open Inspector on the result) | Ctrl+I | Cmd+I |
| Open Playground | Ctrl+OP | Cmd+OP |
| Open Transcript | Ctrl+OT | Cmd+OT |
| Open SystemBroser | Ctrl+OB | Cmd+OB |
| Open Spotter | Shift+Enter | Shift+Enter |
| Browse implementors of selected method or class | Ctrl+M | Cmd+M |
| Browse senders of selected method or users of selected class | Ctrl+N | Cmd+N |
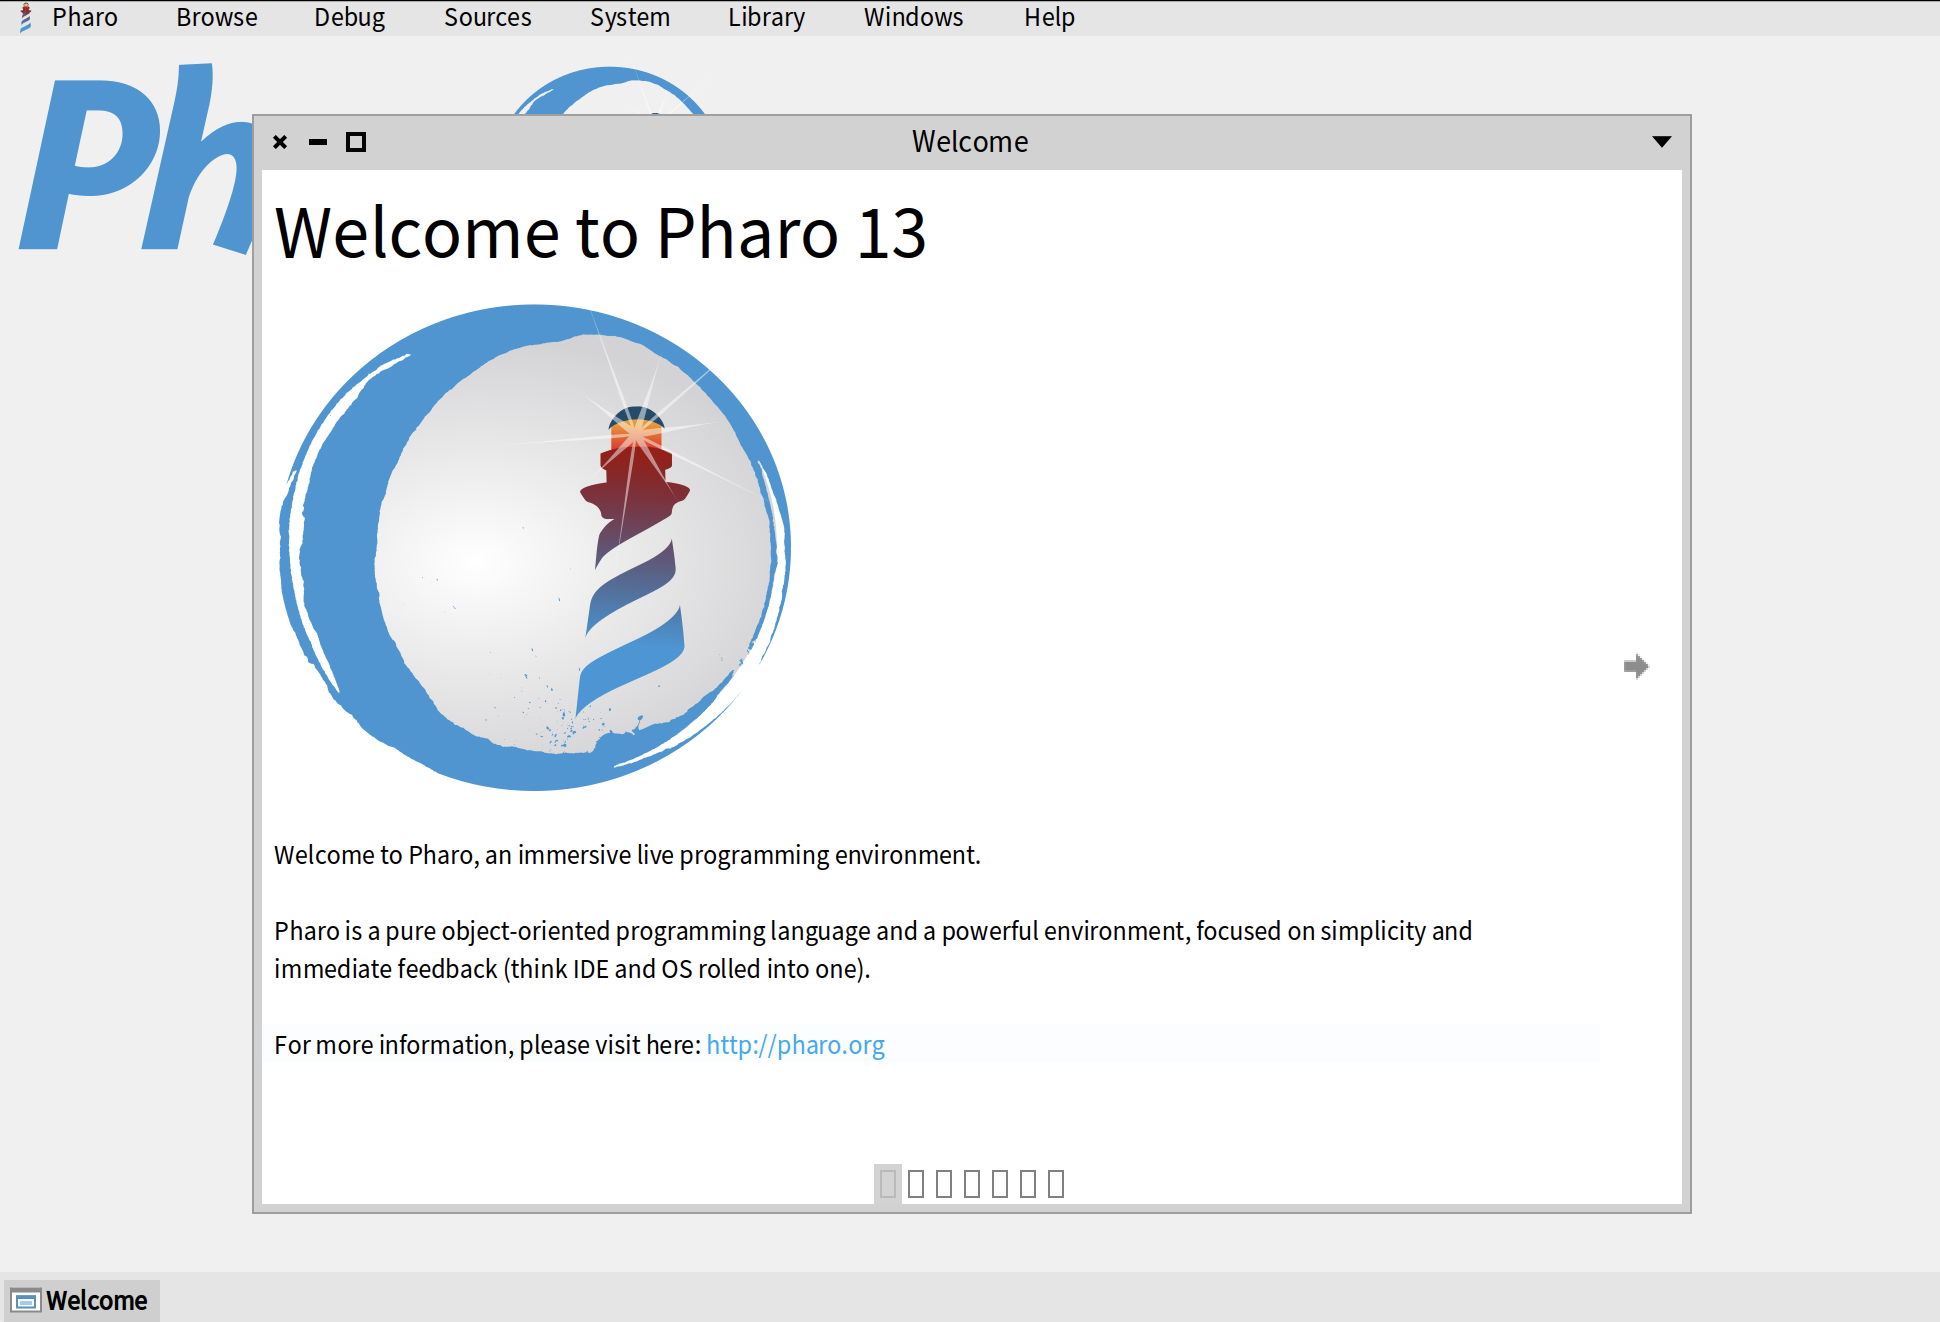
Welcome Window
When you first open a Pharo image, you will be presented with a Welcome window. It contains a lot of useful information, including links to our learning resources, ProfStef tutorial, different themes for Pharo, etc.
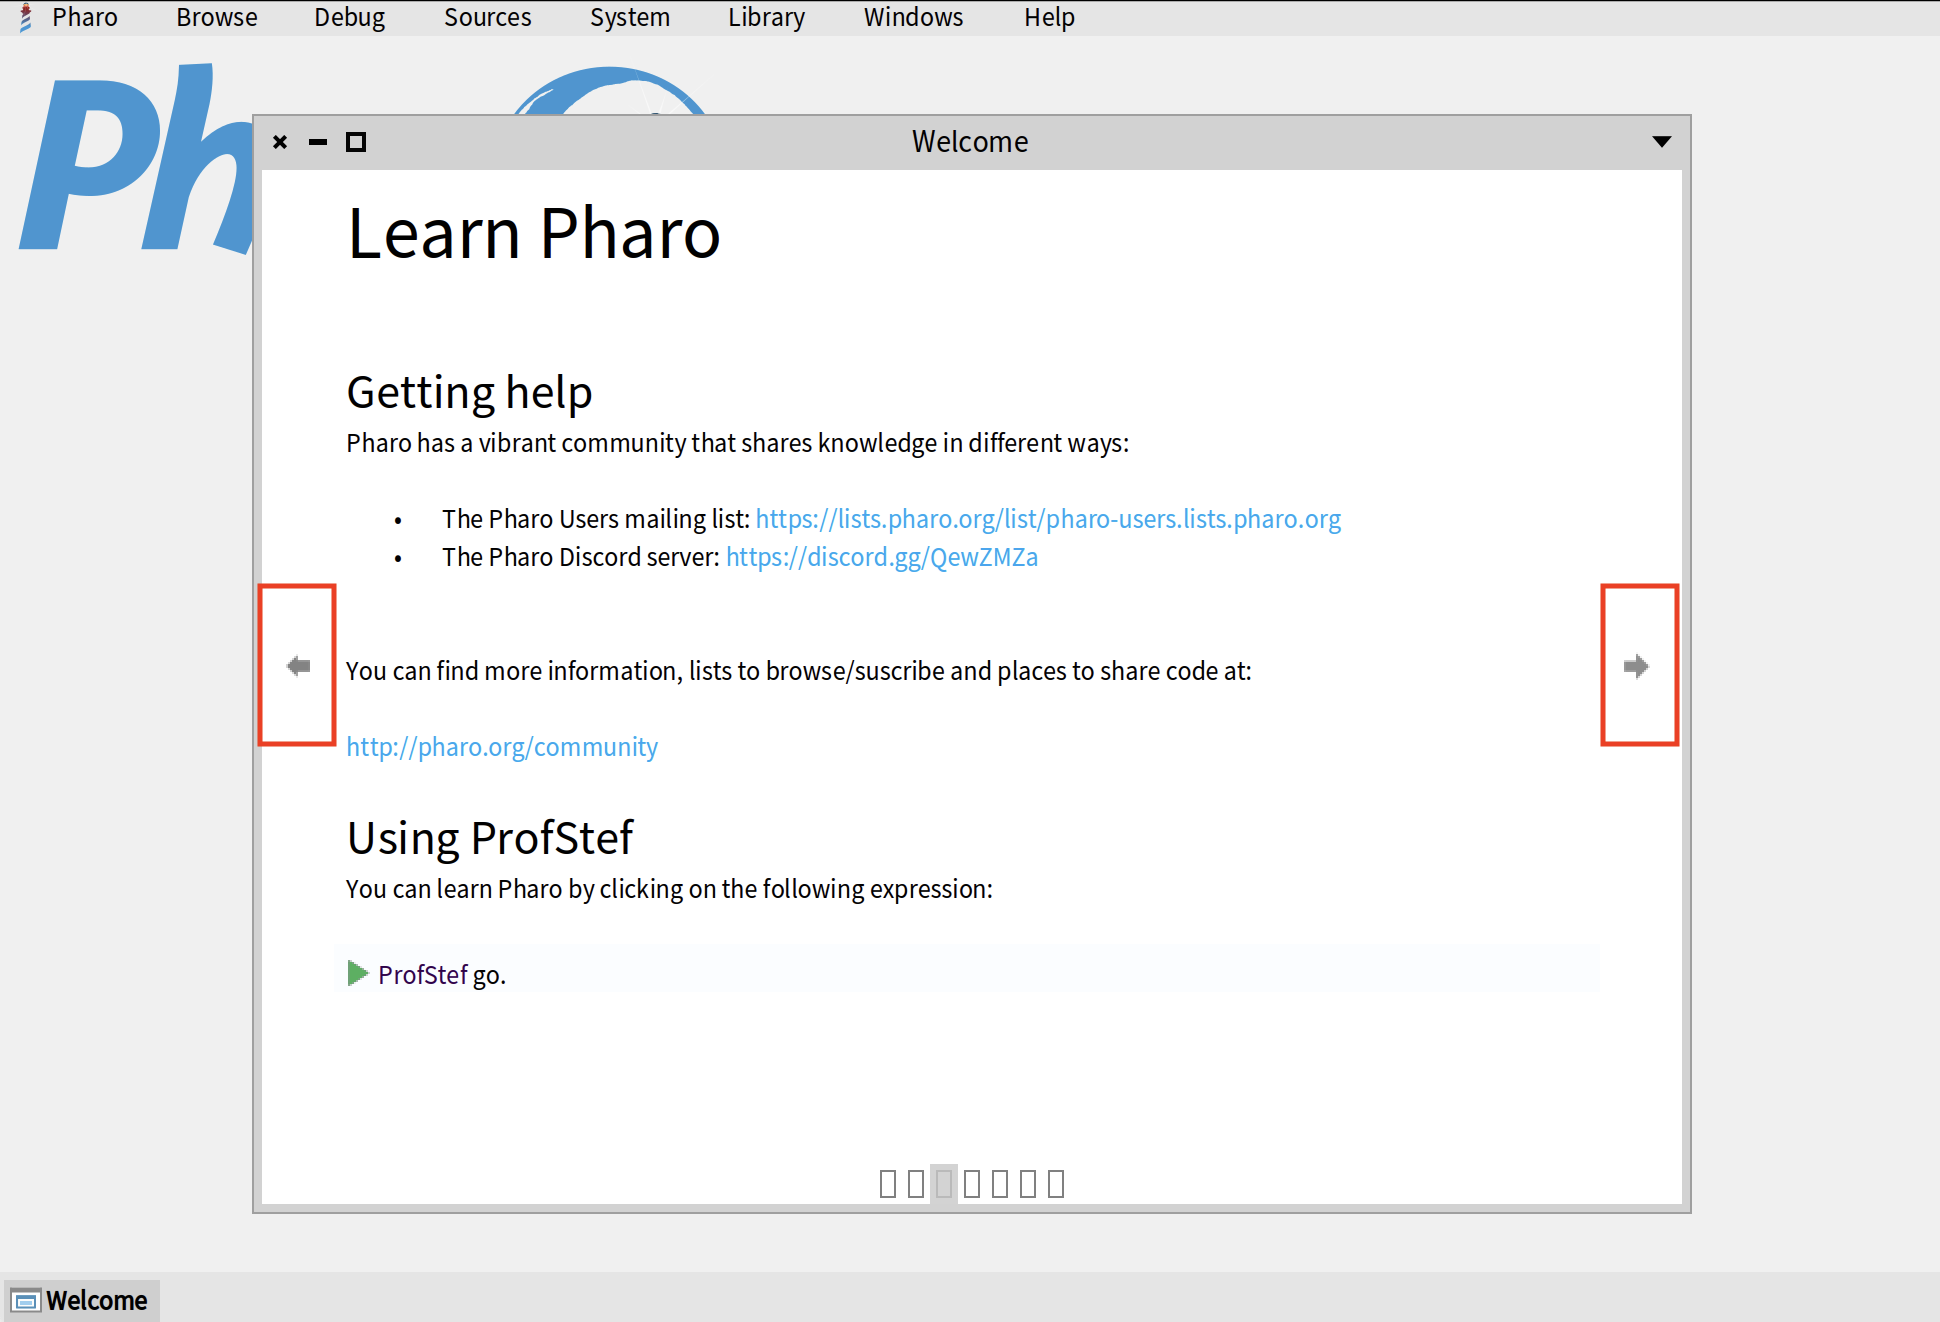
You can navigate through the Welcome Window by clicking on little arrows on the left and right sides.
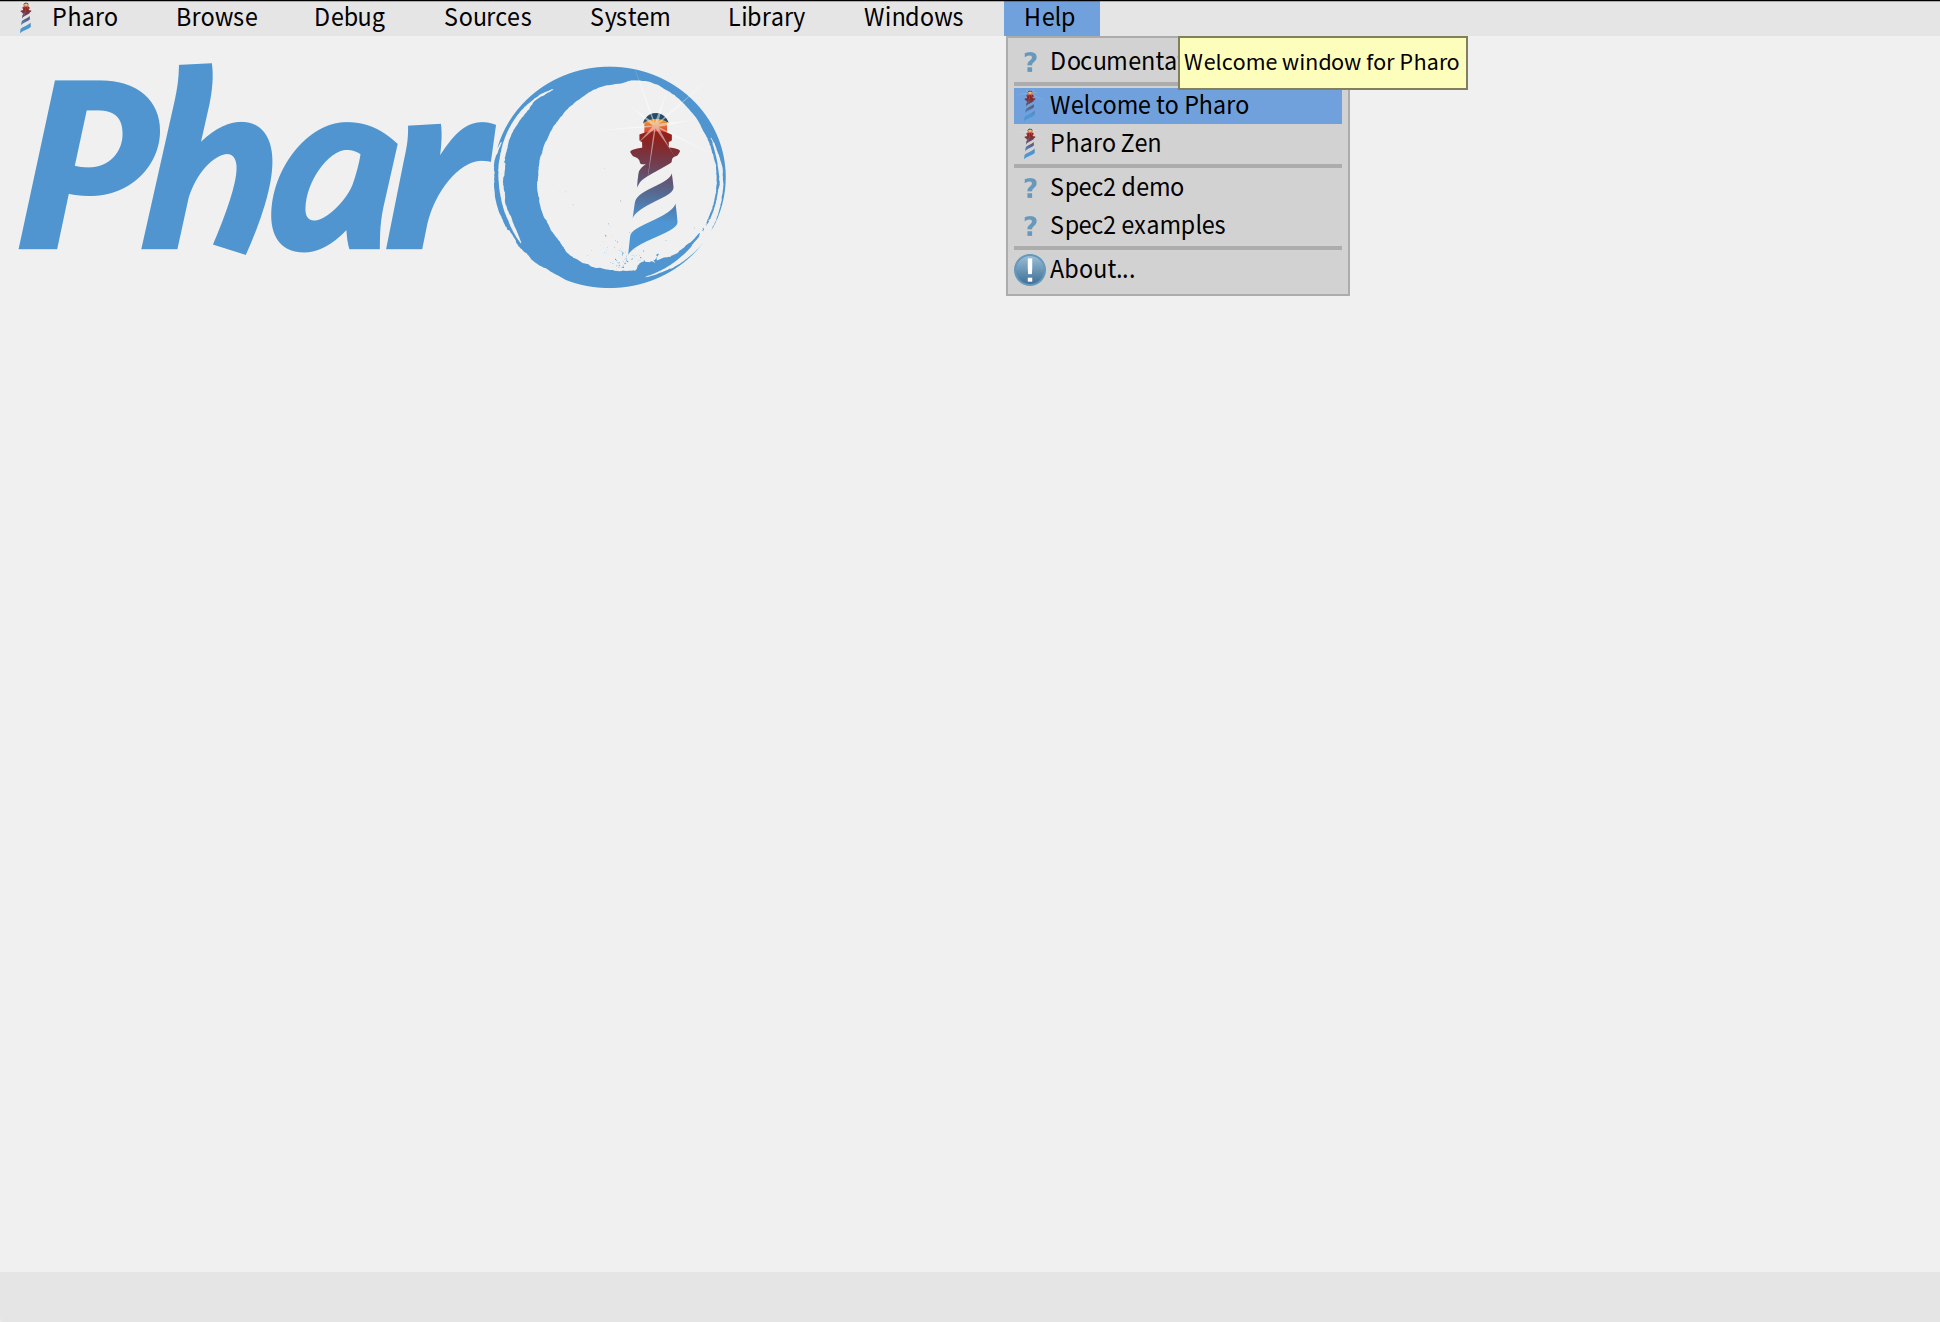
If you close the Welcome Window and want to open it again later, you can do so by clicking on About > Welcome to Pharo.
World Menu
Once you close the welcome window, you will be presented with an empty environment with a Pharo logo in the top-left corner. This space is called "Pharo World". On top of your world, you wll see a menu which we call "World Menu". It allows us to access all the main tools of Pharo, manage Pharo image, access image settings, etc.
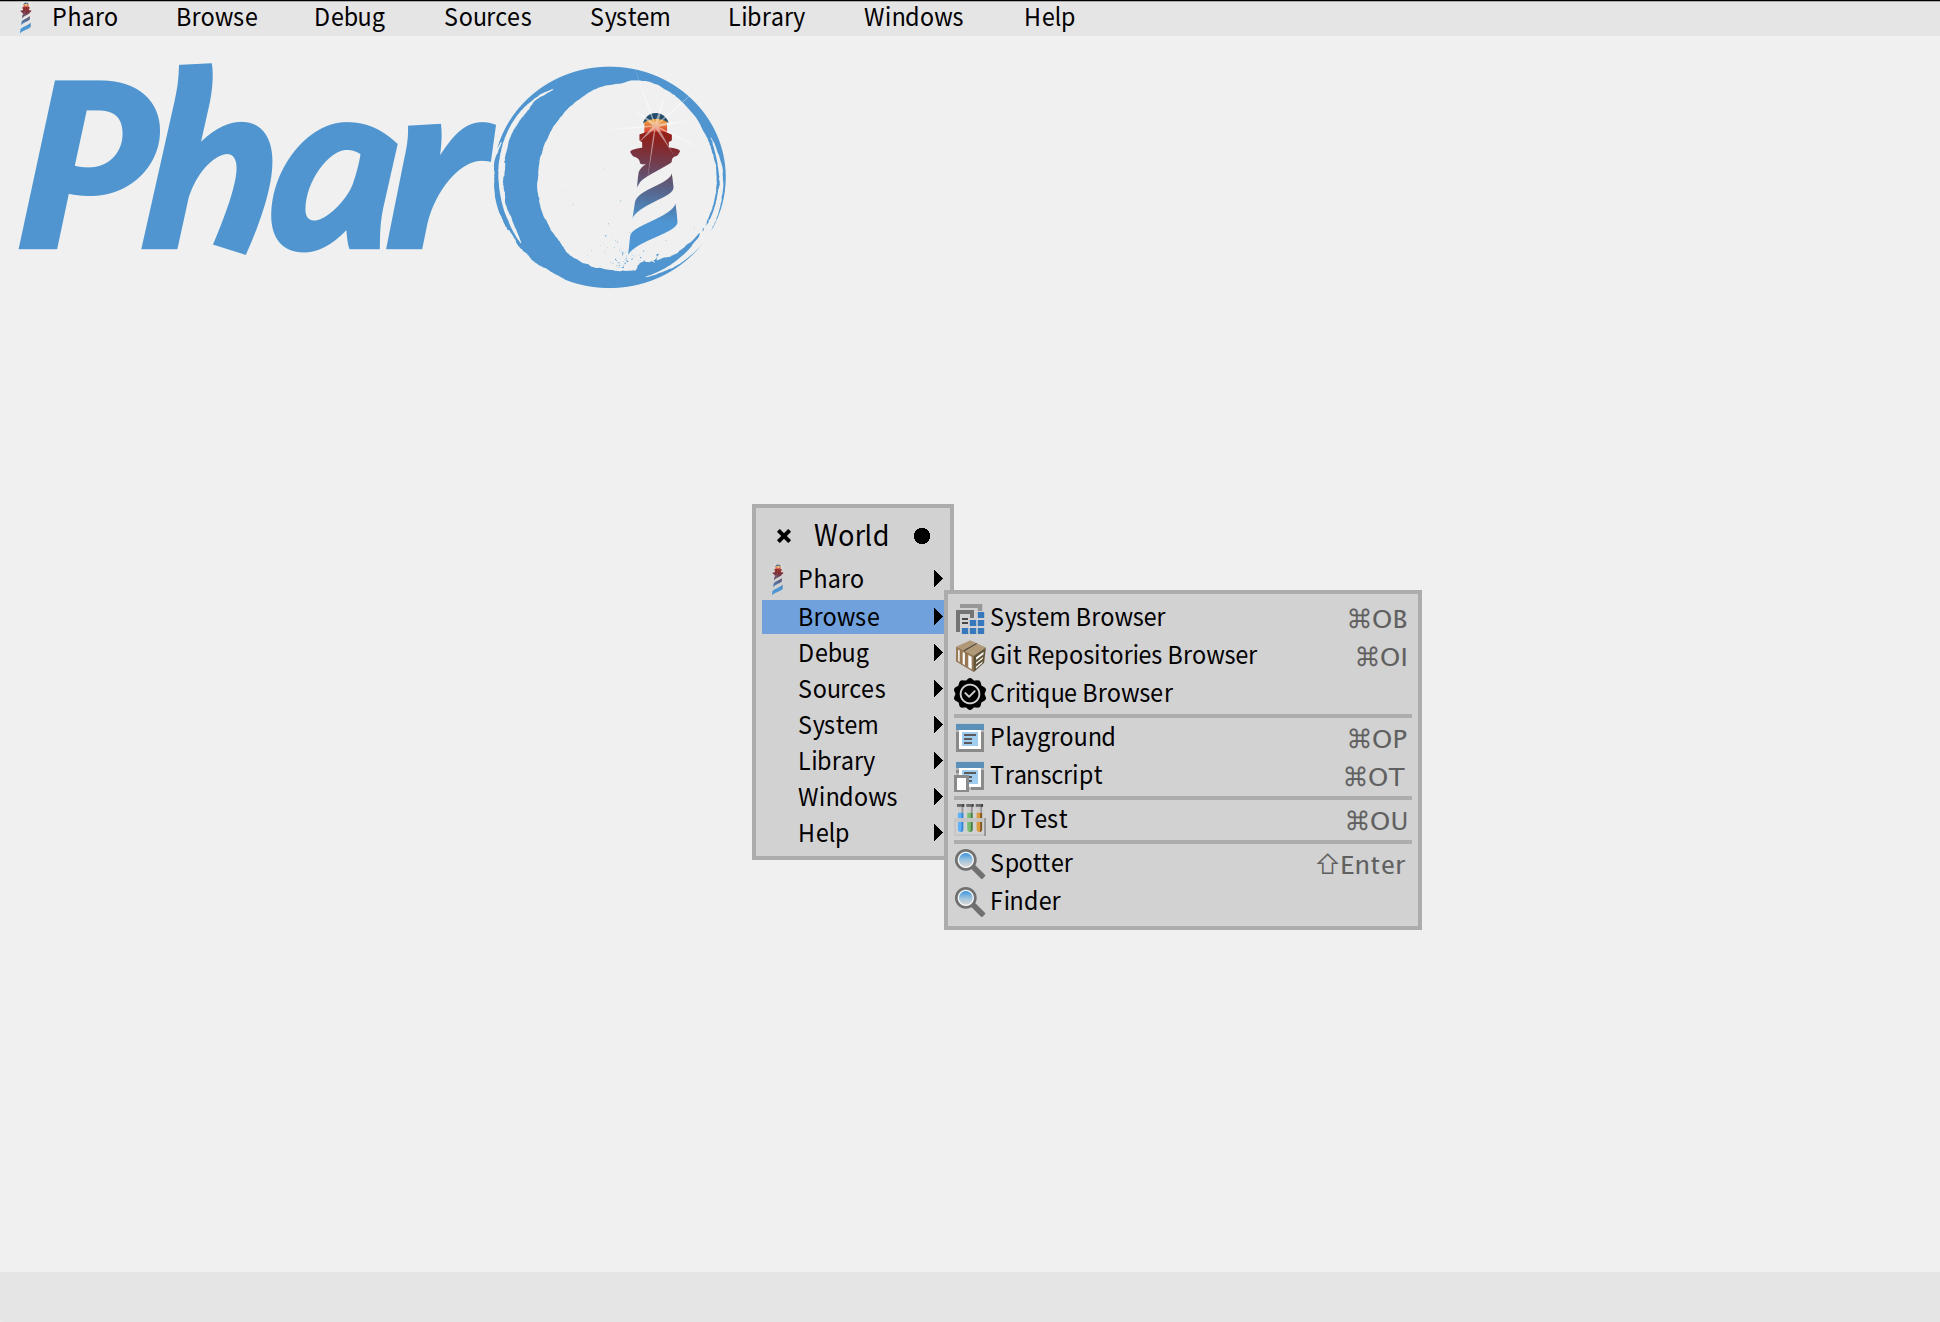
You can also access World Menu by right-clicking anwhere in your world. It will be exactly the same menu.
Playground
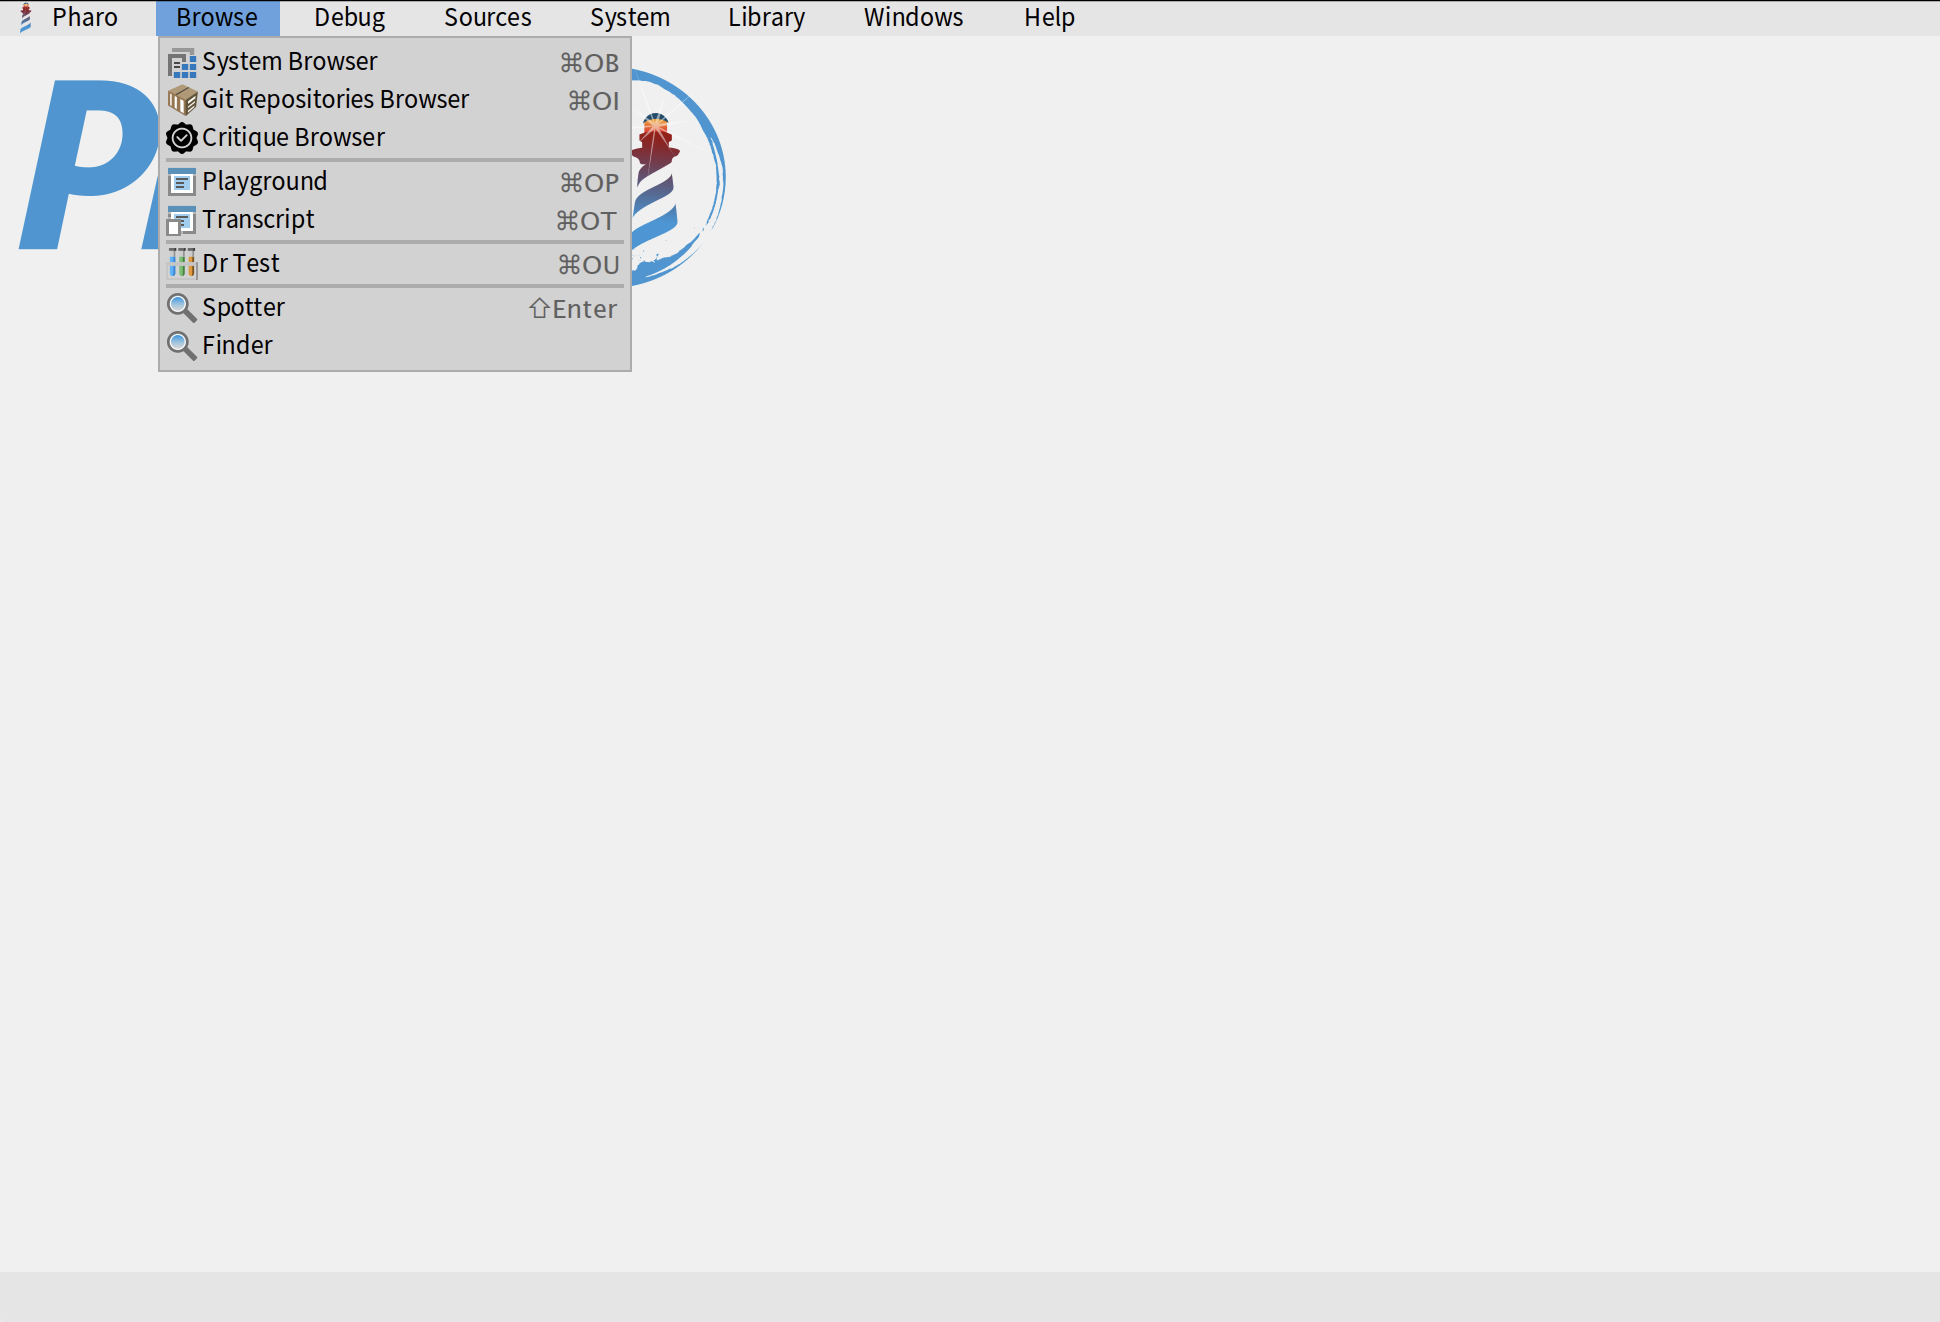
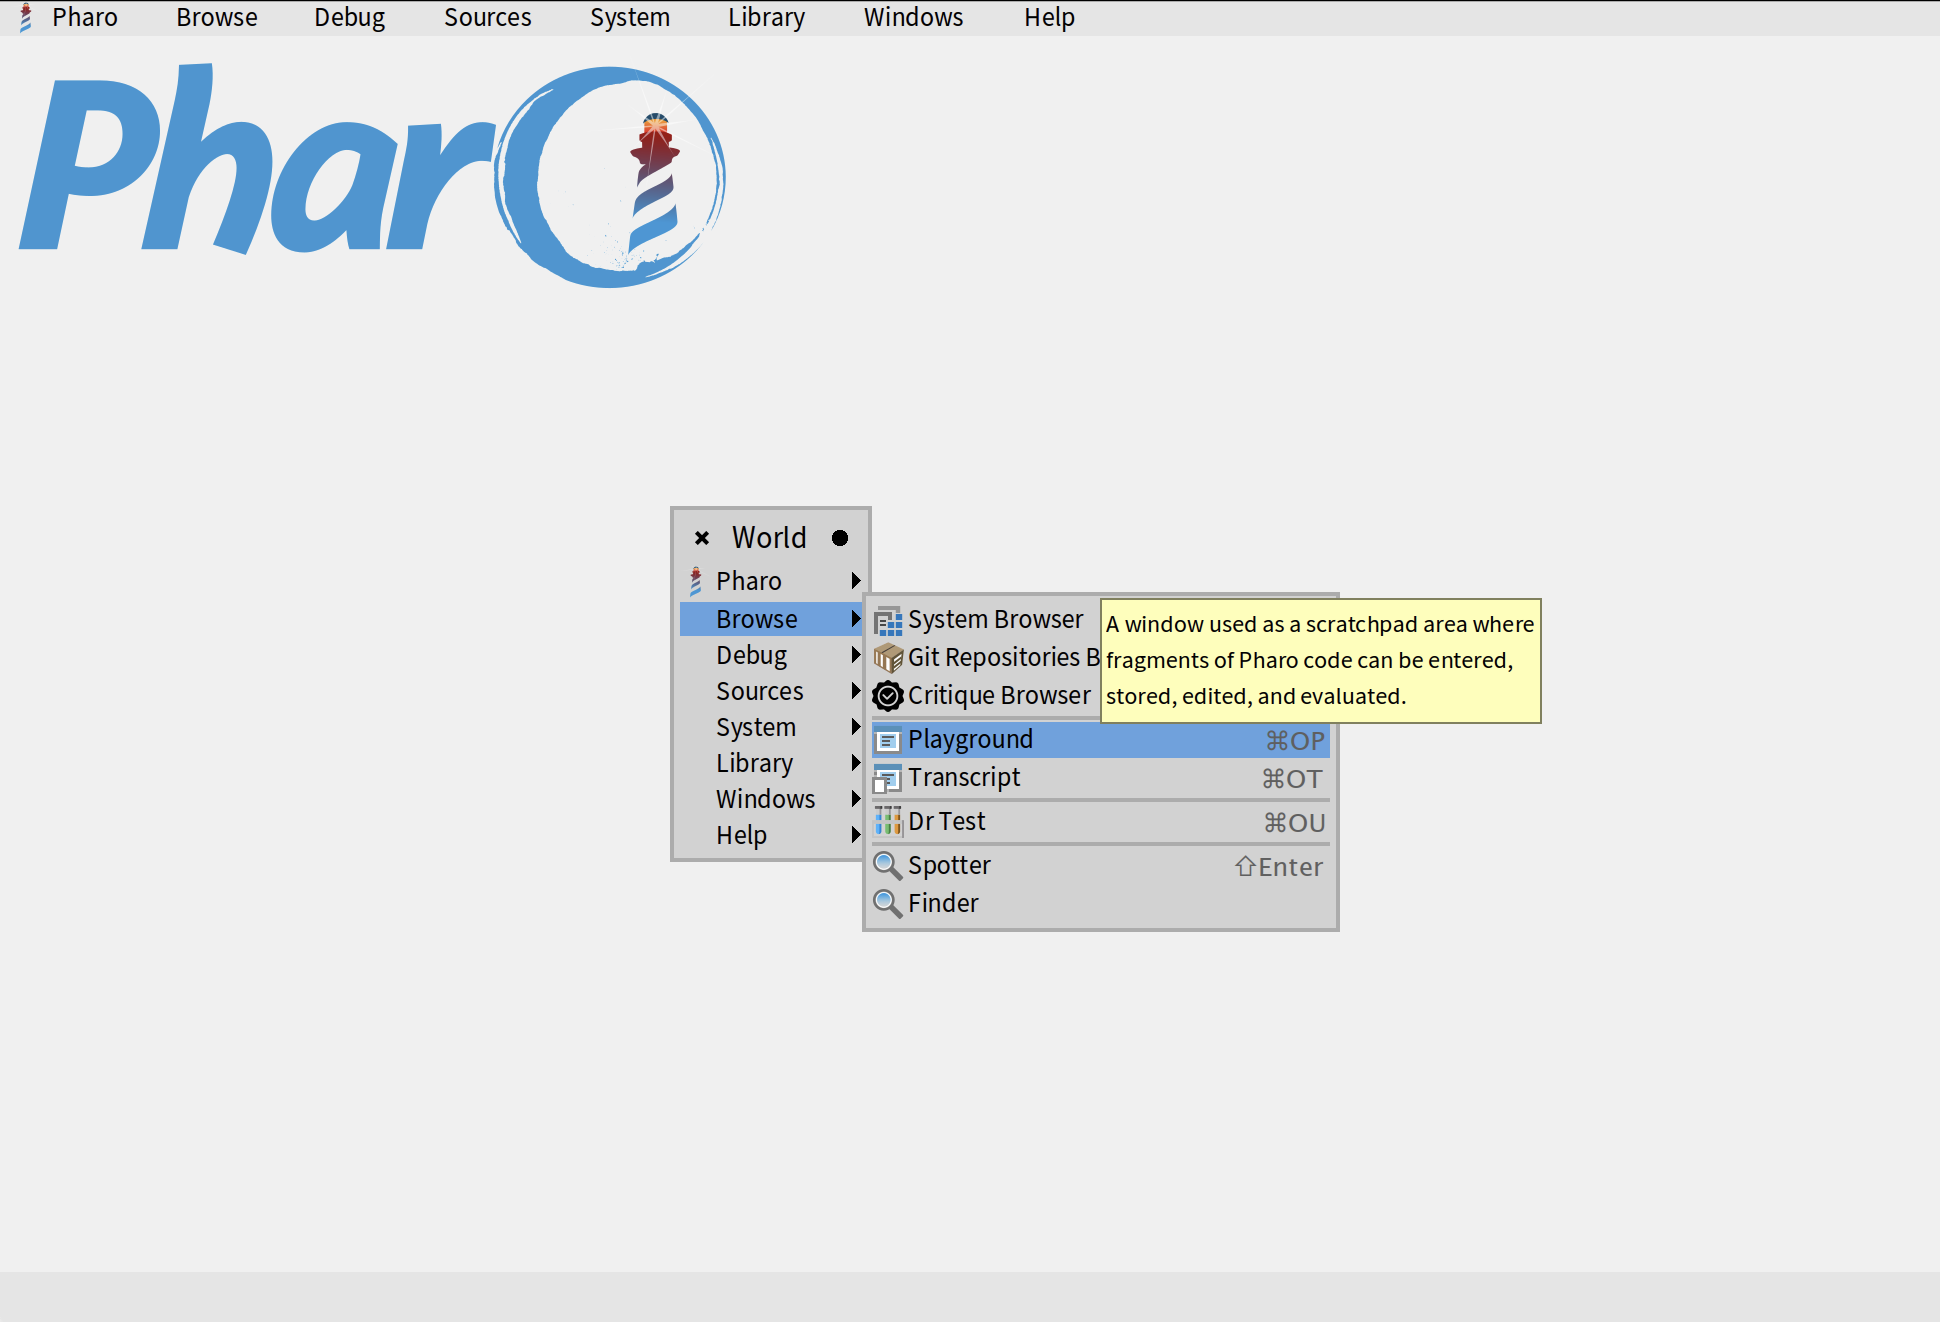
The first tool that you will learn is called "Playground". It allows us to execute code and try different code snippets. As a general rule, we don't program in Playground. As the name suggests, it is only used for trying out different things. The actual code is written in "System Browser", a tool that will be presented in the following sections. To open Playground, you can select Browse > Playground in your world menu. You can also use a keyboard shortcut Ctrl+OP on Windows or Linux or Cmd+OP on Mac.
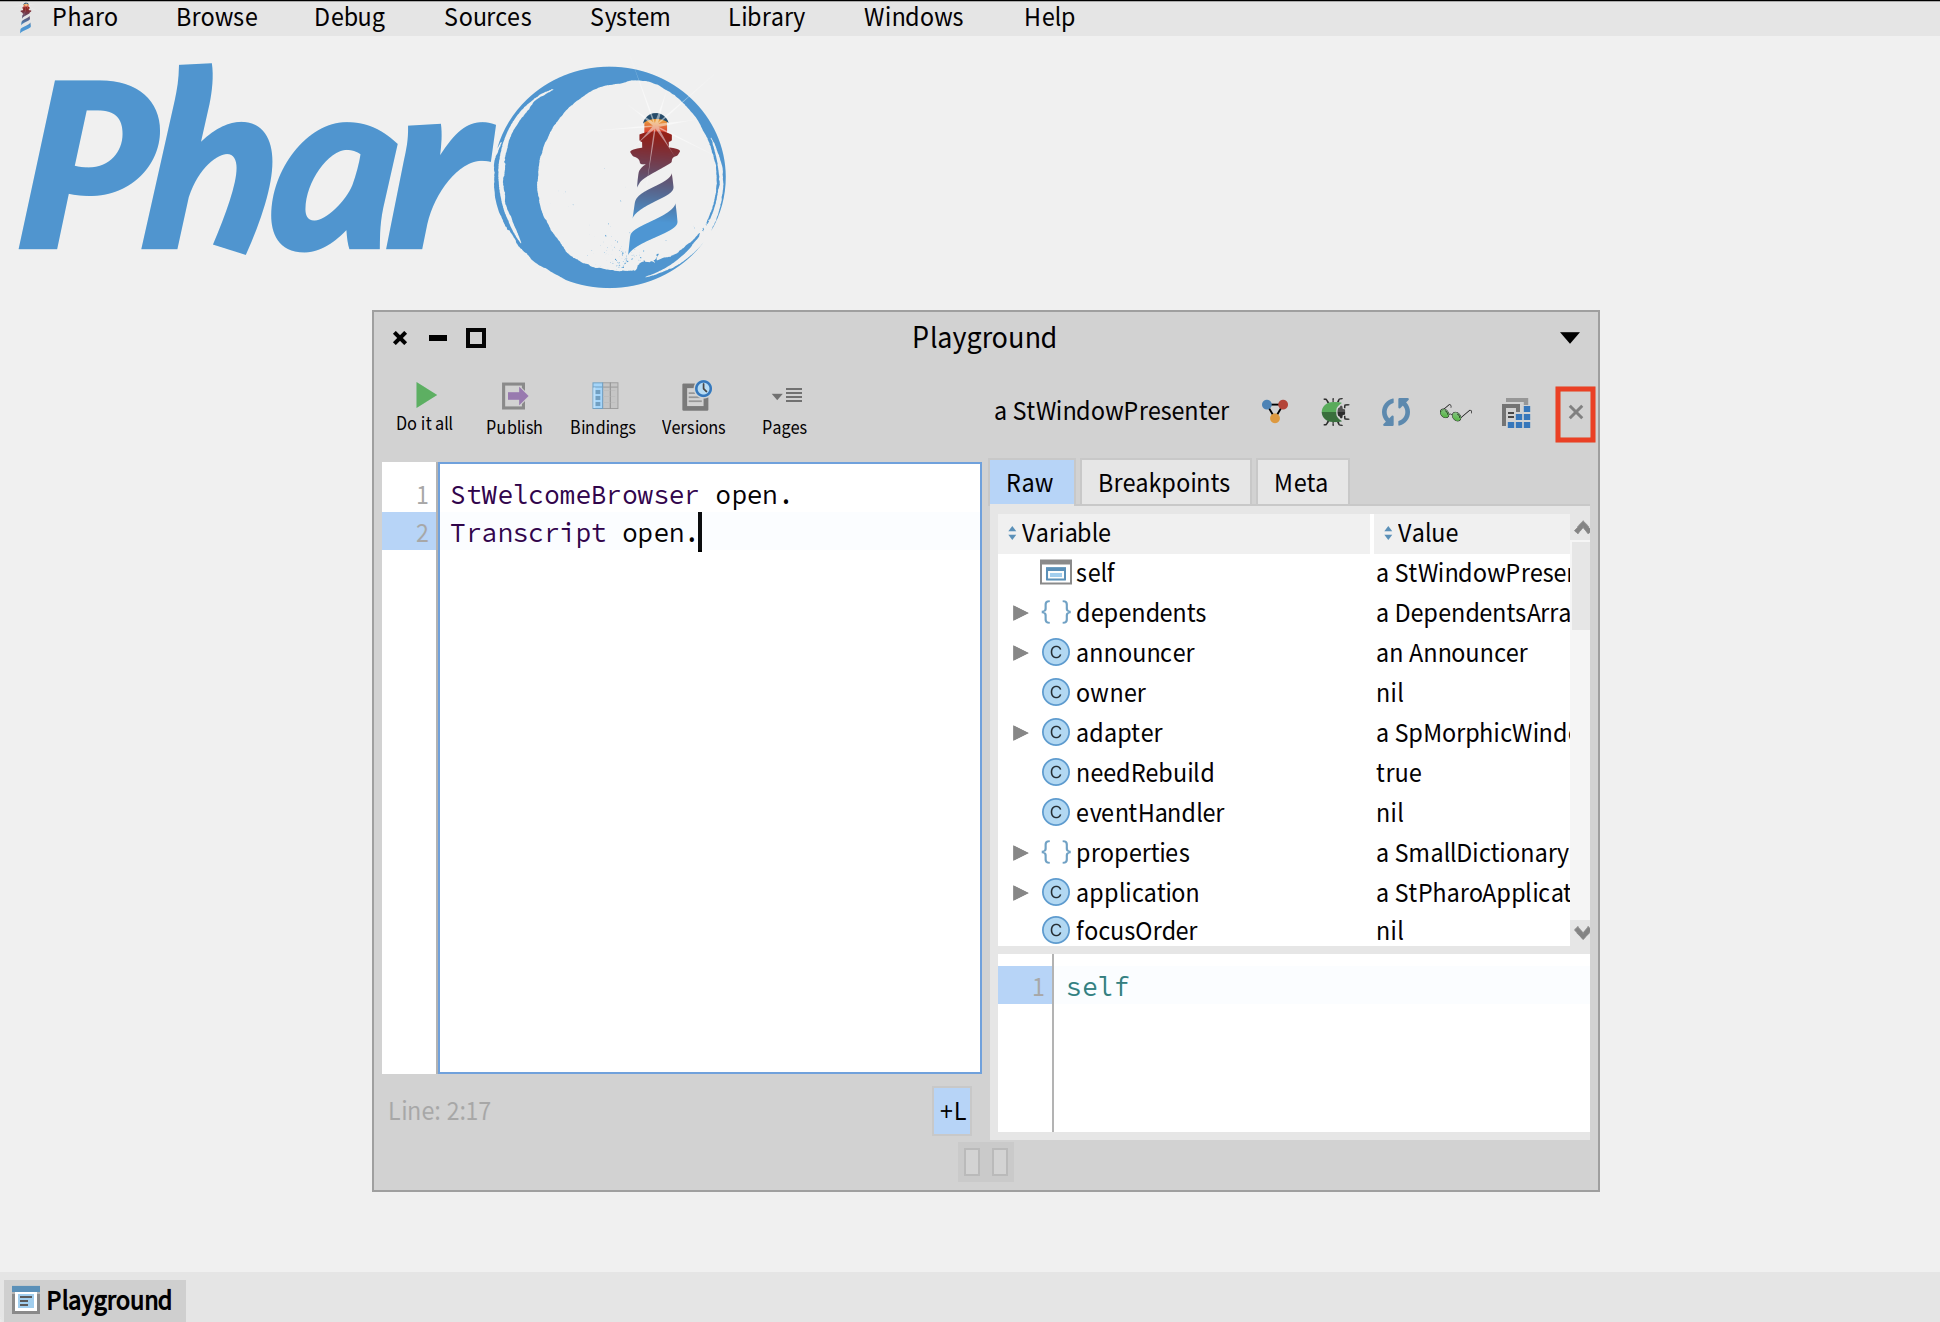
Copy the following two lines to your Playground and click on "Do it all" button in the top-left corner.
StWelcomeBrowser open.
Transcript open.
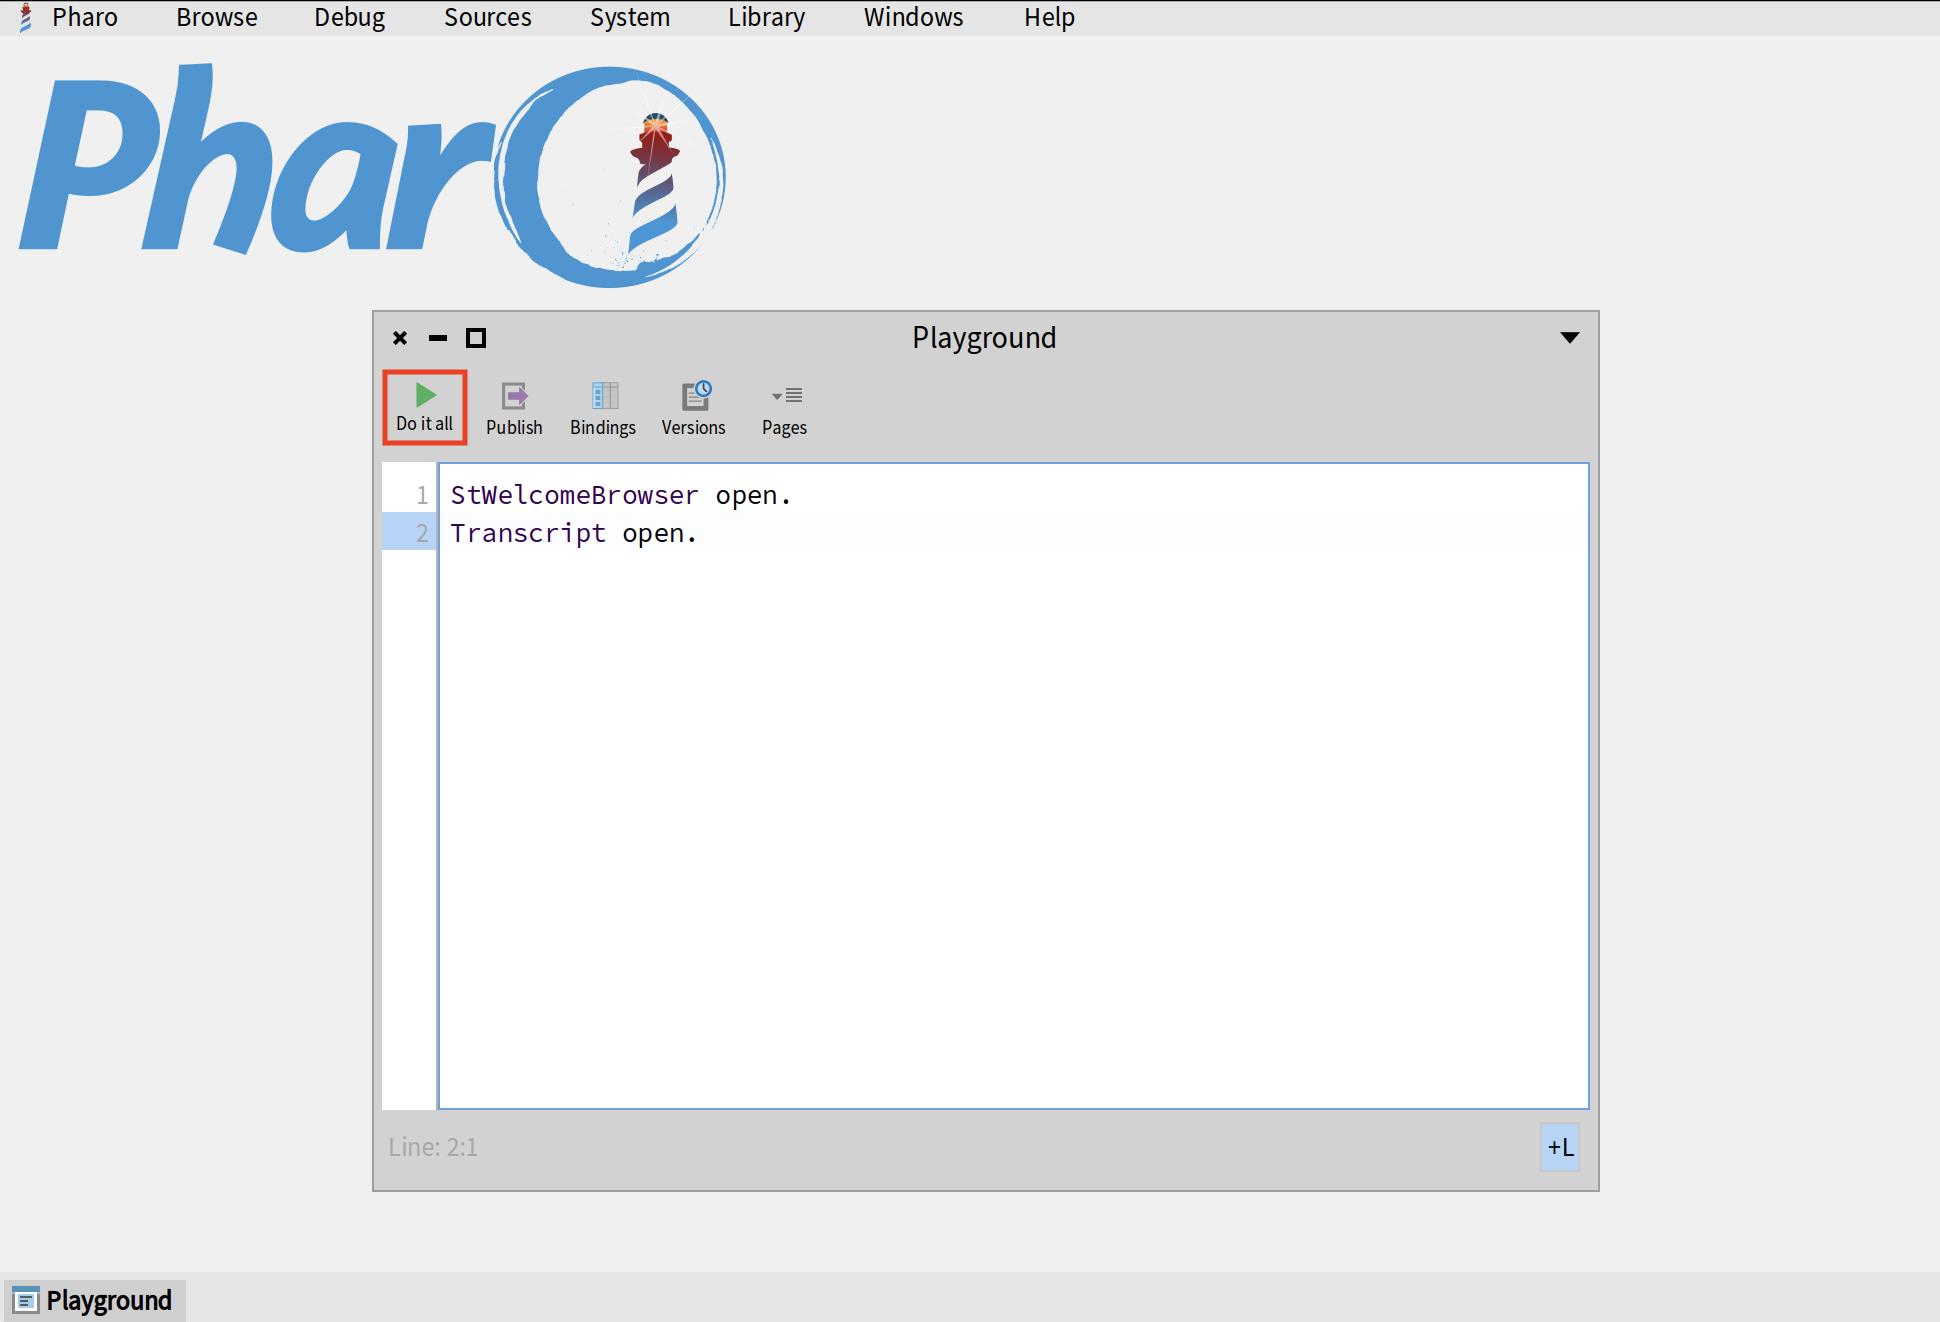
This button executes the entire contents of your Playground. In this case, it will execute two lines that we wrote: first it will open the Welcome Window, then it will open a Transcript (another tool that you will learn in the following sections). "Do it all" button will also open an inspector in the right half of your Playground on the object returned by the last line. We will explain Inspector in the next sections. For now, you can just close it by clicking on the little cross in the top-right corner.
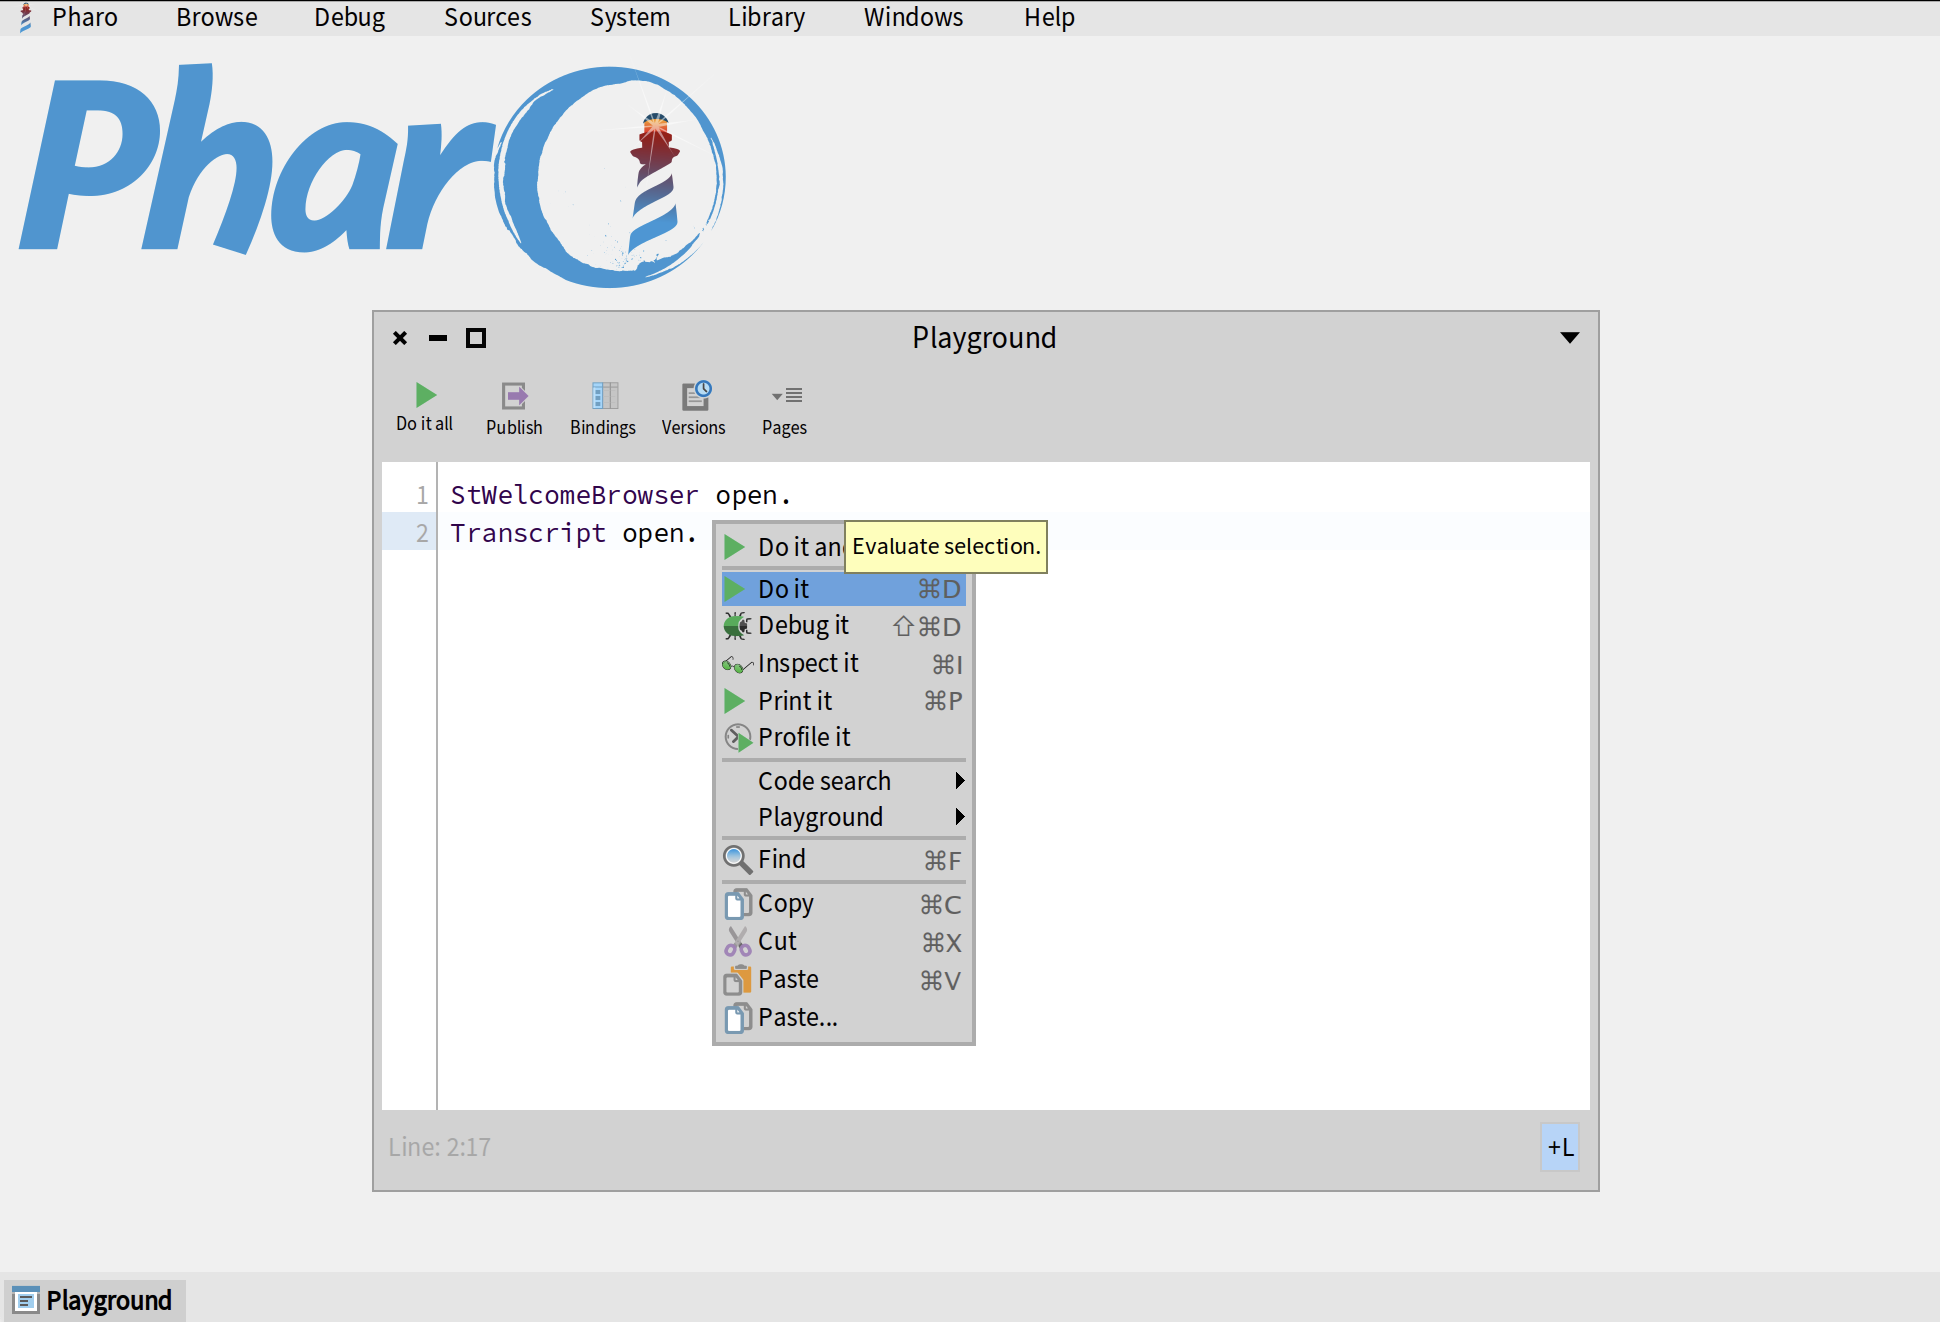
You can also execute one specific line by placing your cursor on it, right clicking and selecting Do it from the menu. Alternatively, you can use a keyboard shortcut Ctrl+D on Windows and Linux or Cmd+D on Mac. If you want to execute multiple lines at one, select them with your mouse and do the same.
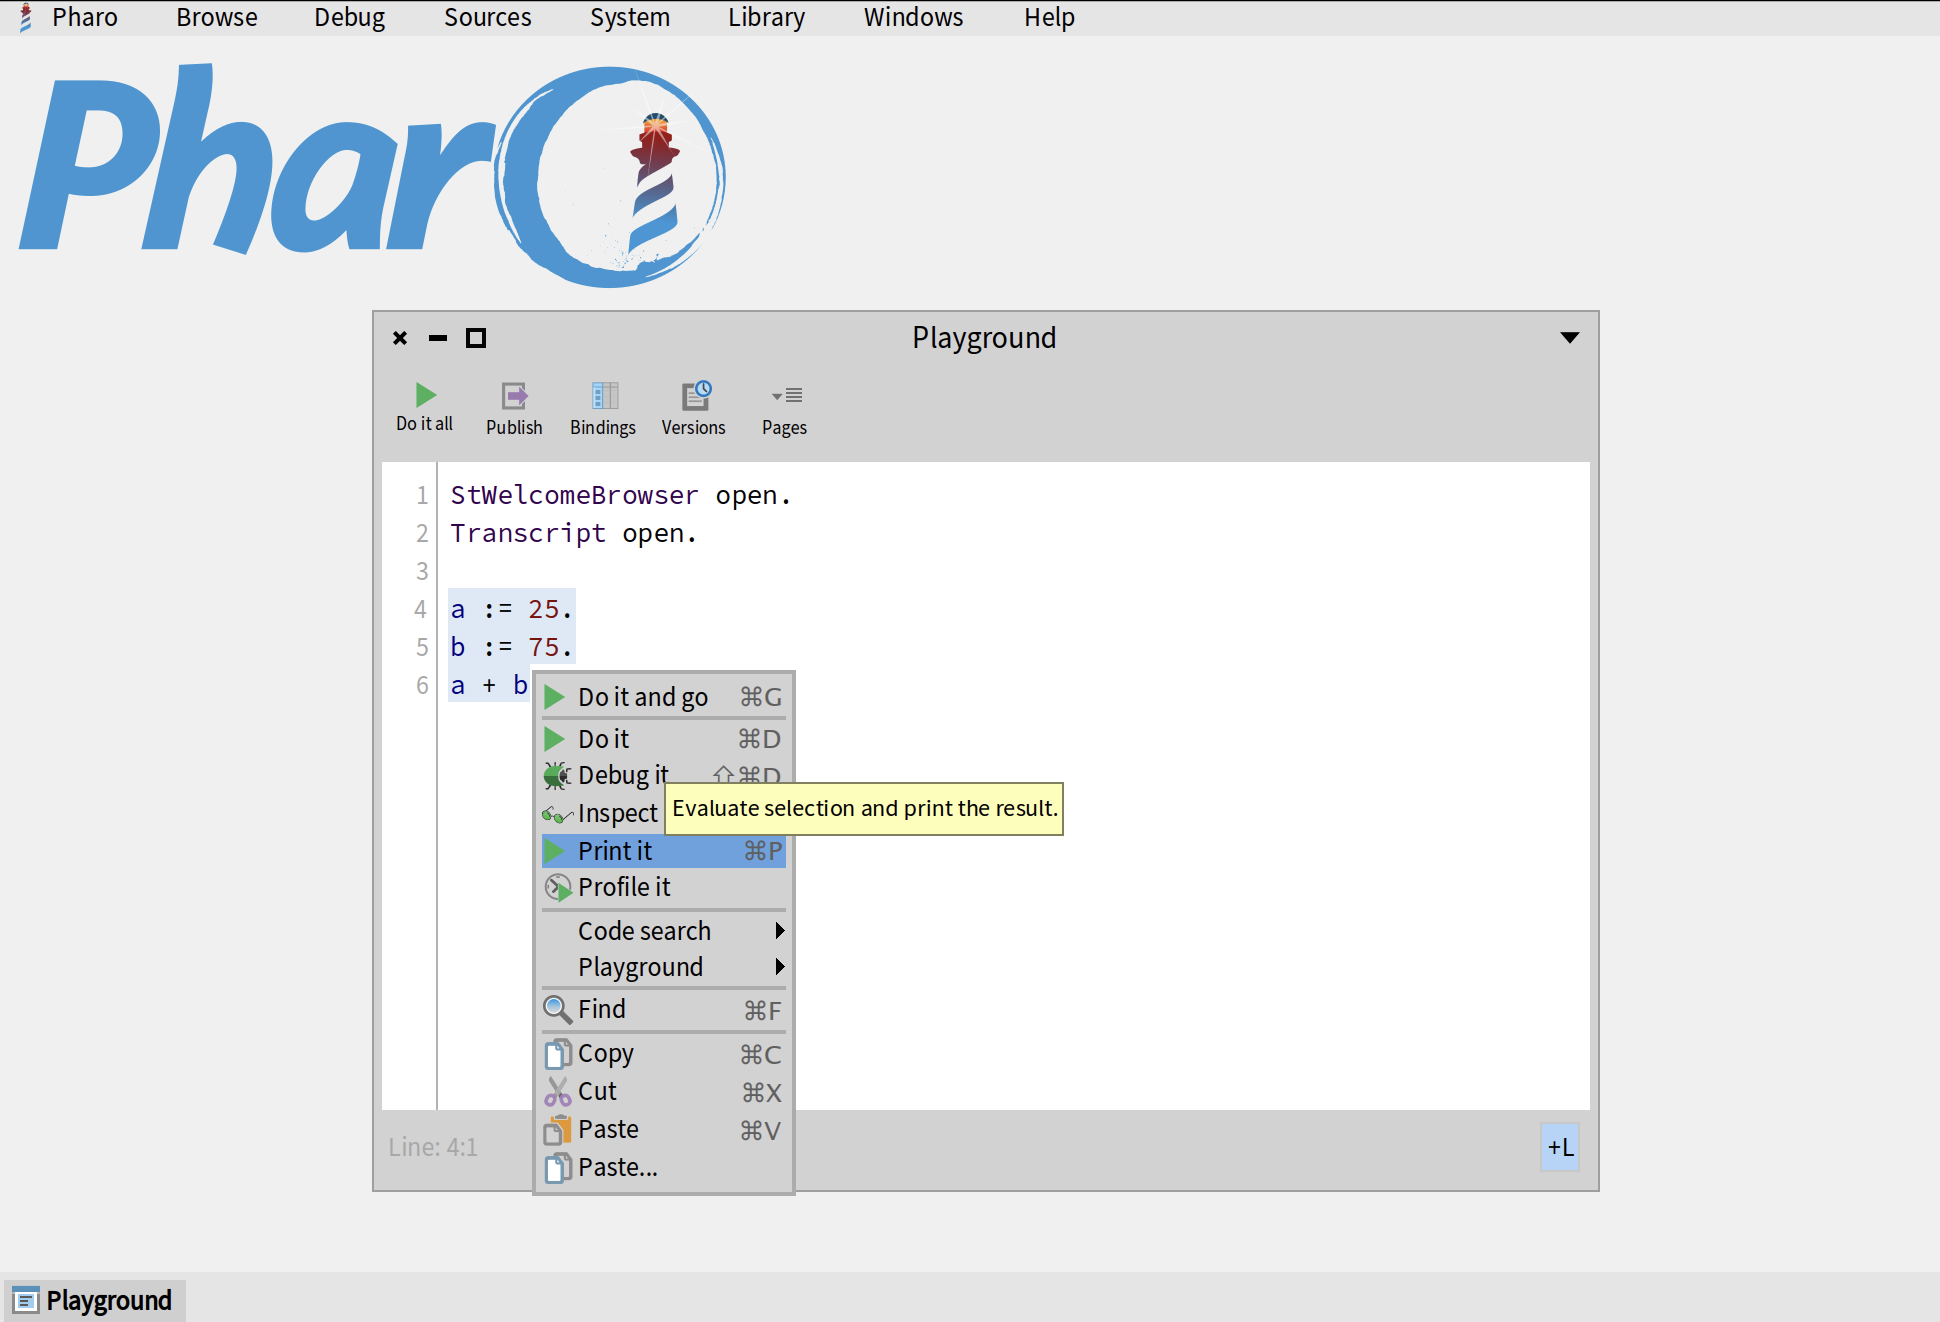
Let's add some more lines, evaluate (execute) them and print the result. Don't worry if the variables are highlighted in red. This happens because they are not explicitly declared. But as soon as you execute your code in the Playground, it will automatically declare all varibles for you. Select the lines that you added, right-click and select Print it from the menu. You can also use the shortcut Ctrl+P or Cmd+P on Mac.
a := 25.
b := 75.
a + b
Inspector
The second important tool that you must learn is called "Inspector". It is a window that represents an object. The default inspector will show you the propertioes of an object and allow you to interact with it by sending messages. You can also define custom tabs for an inspector to add custom representations (e.g., visualizations, tables, graphs, etc.) for your objects.
Let's start with a simple example. In your Playground, write the following, right-click on in and select Inspect it from the menu. You can also use the keyboard shortcut Ctrl+I or Cmd+I on Mac.
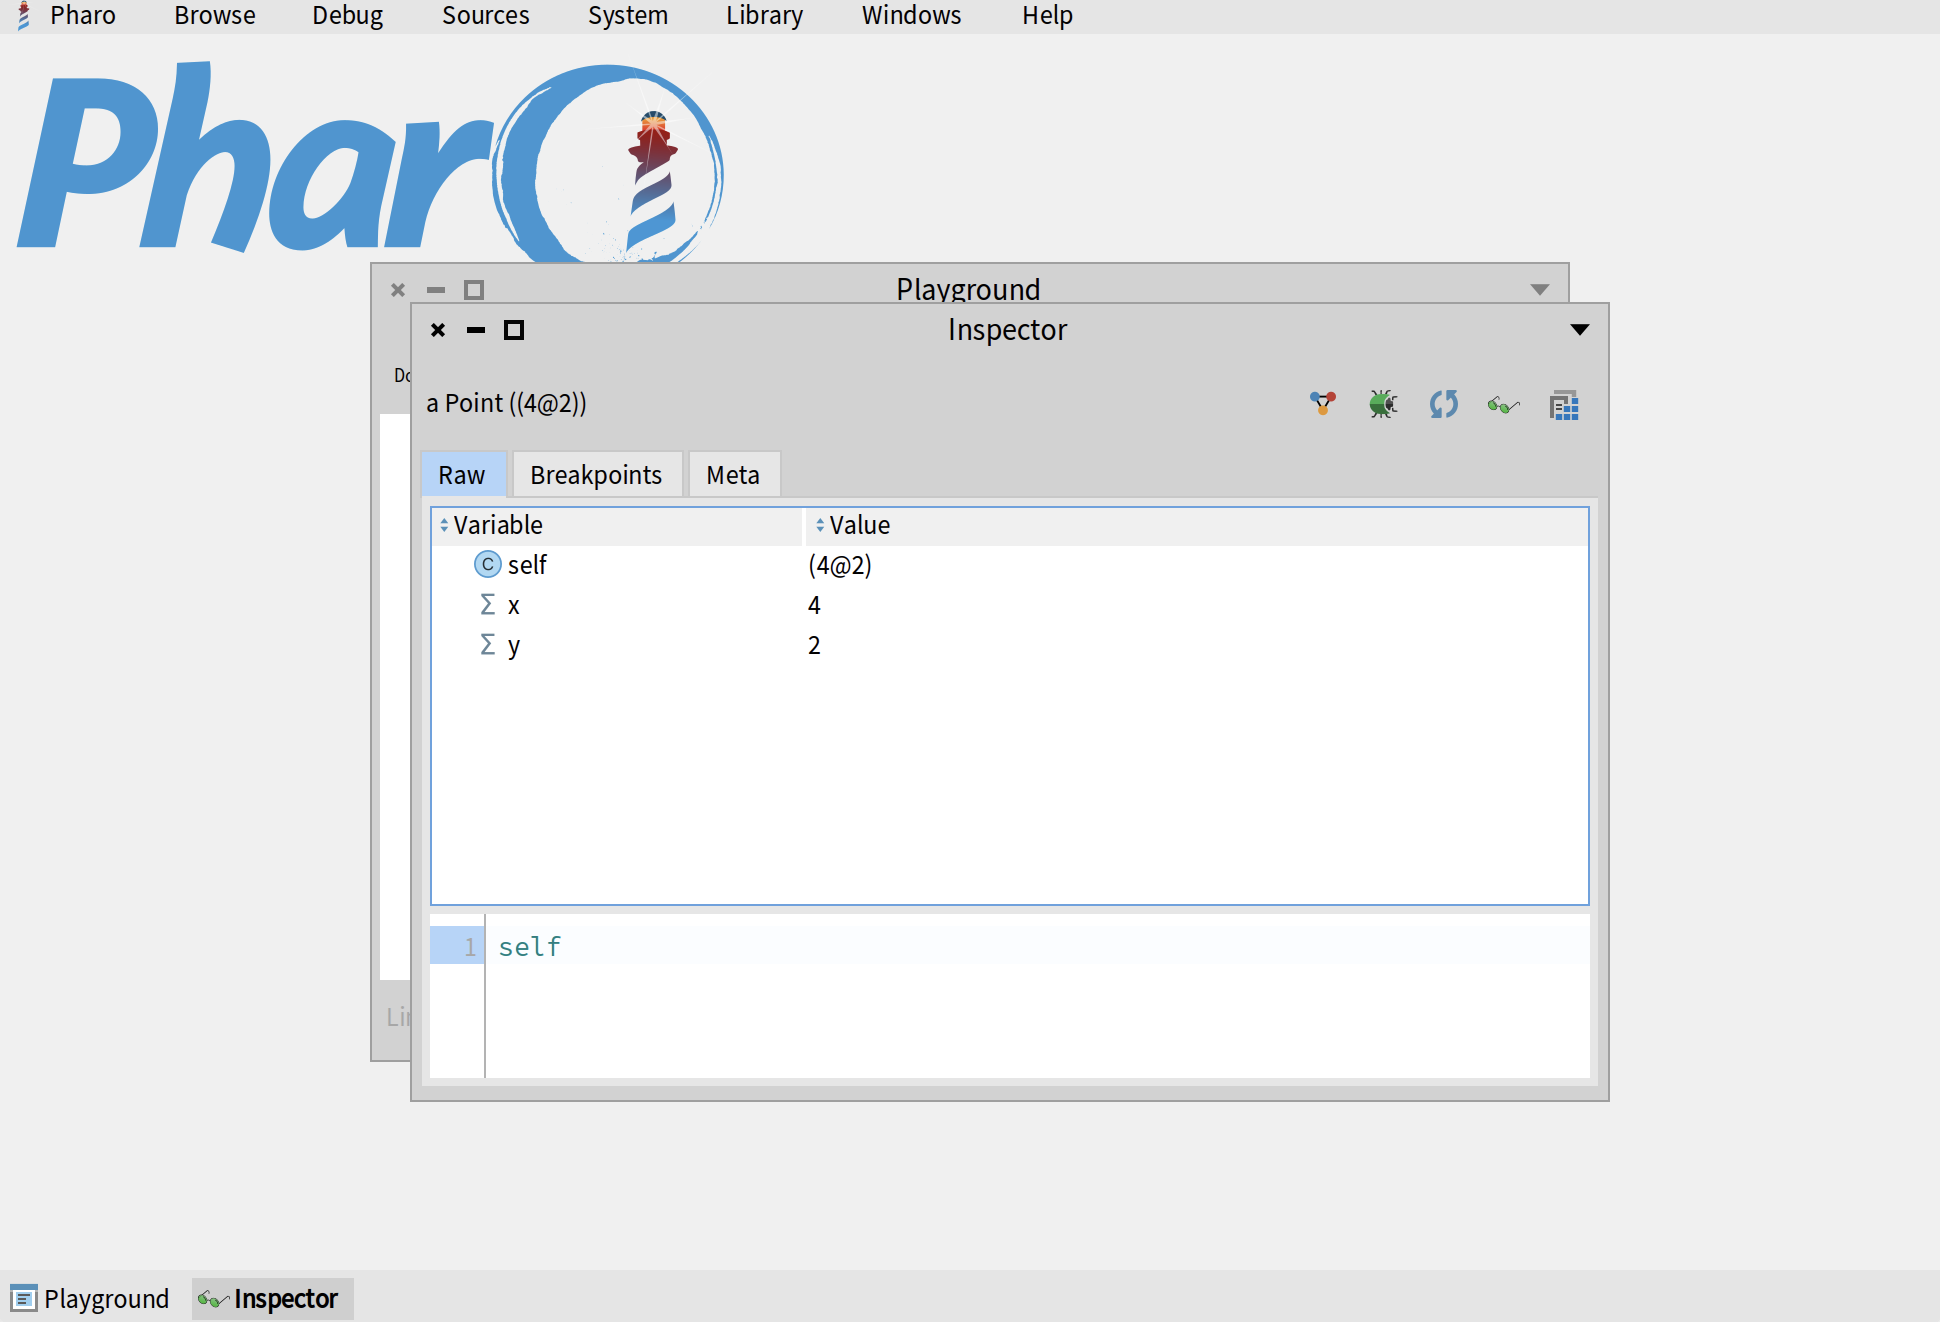
4@2
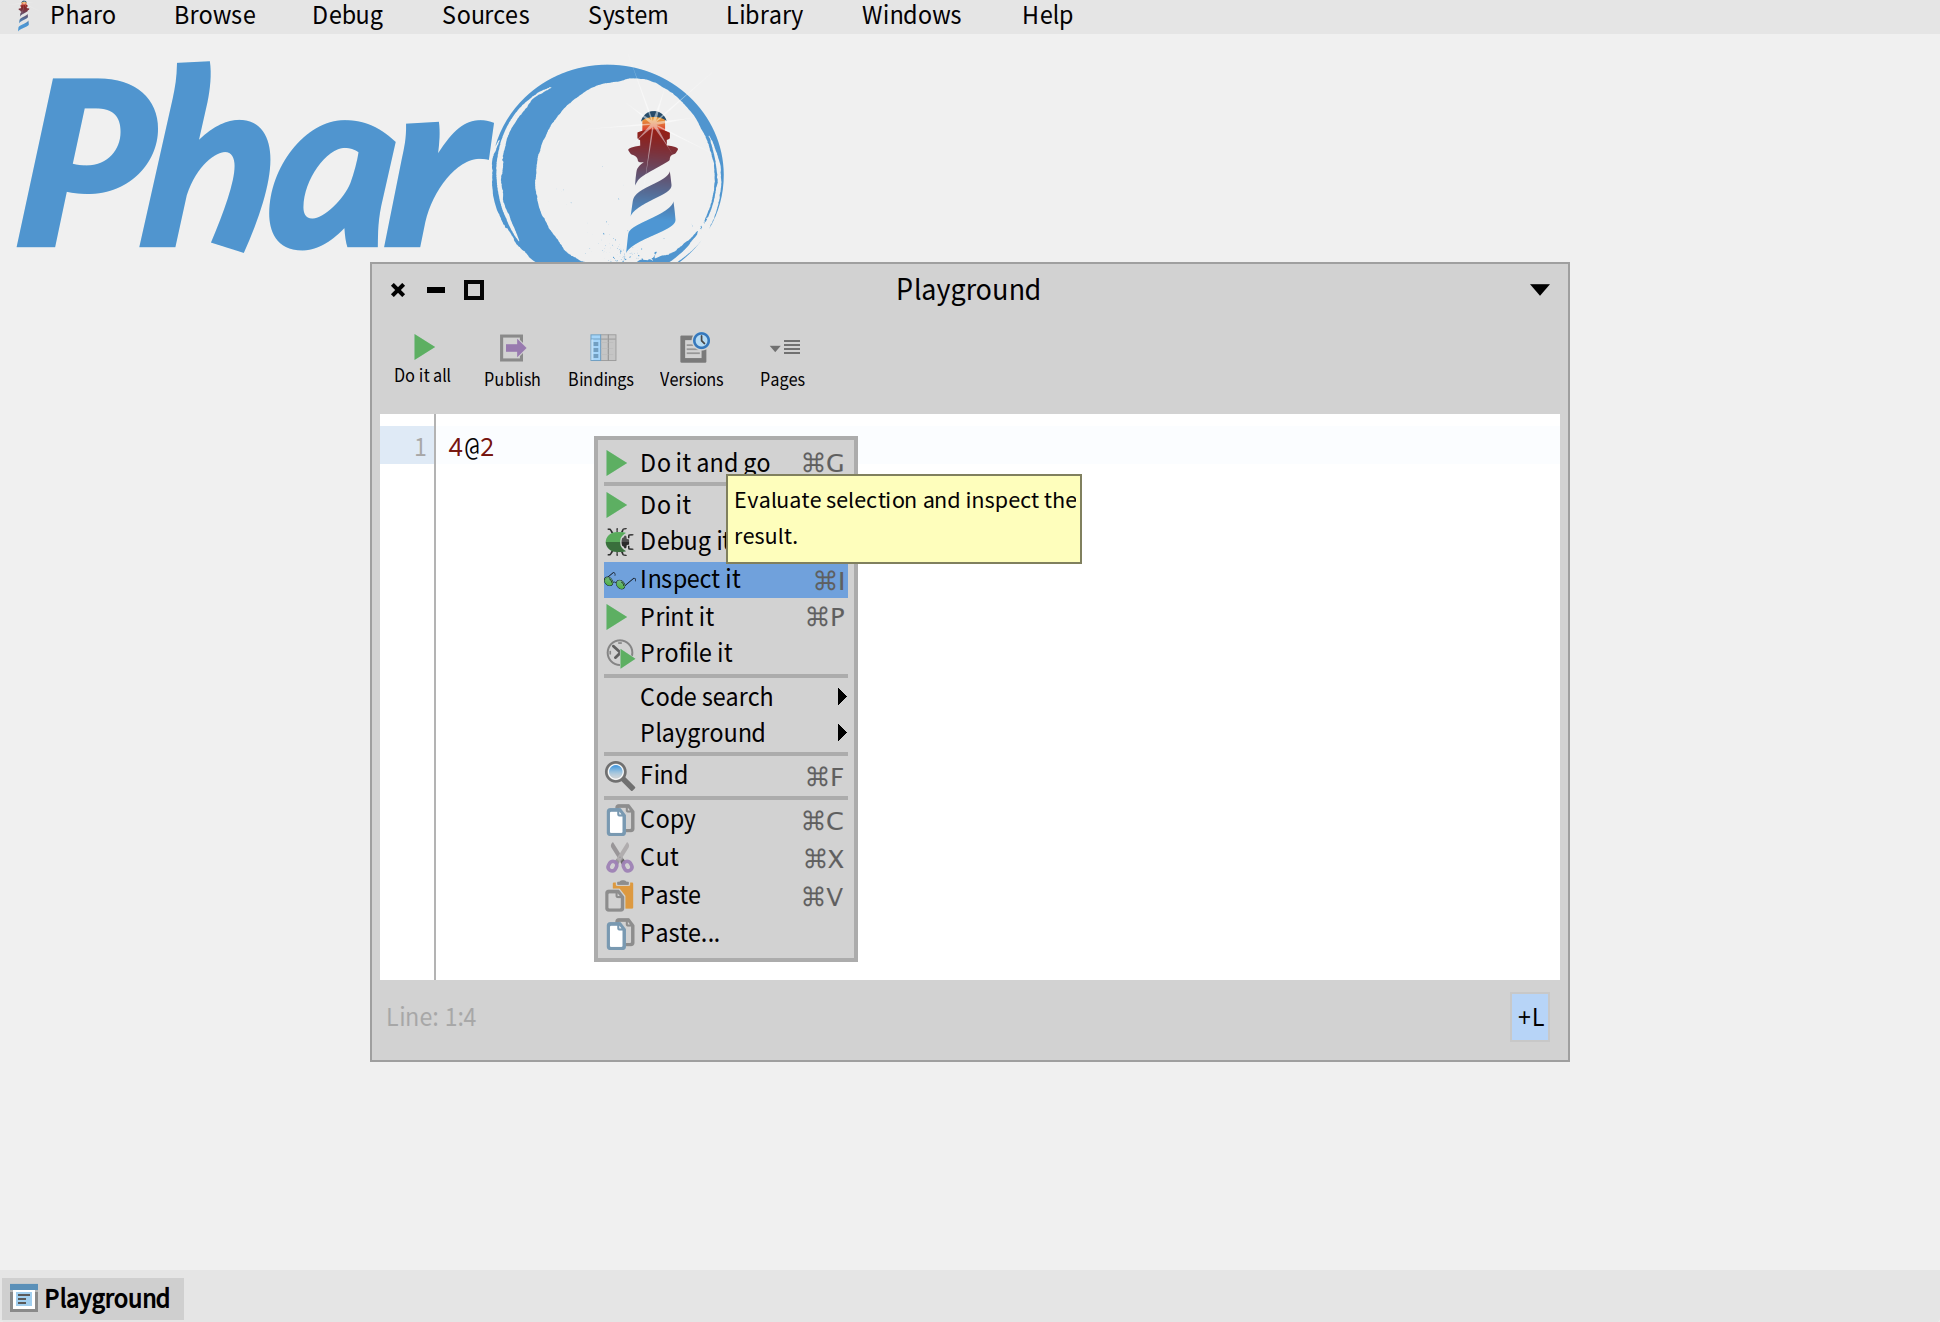
This will create a new instance of a Point class which represents a point (4,2) and open an inspector for this object. The default inspector tab is called Raw. It shows you the names and values of all instance variables. In our case, the object has two variables: x which holds the value 4 and y which holds the value 2.
If you click on any variable in this tab, it will split the window and show another inspector on the right for the object that you selected. In the example below, I click on variable x and get an inspector of number 4 which is an instance of Smallinteger.
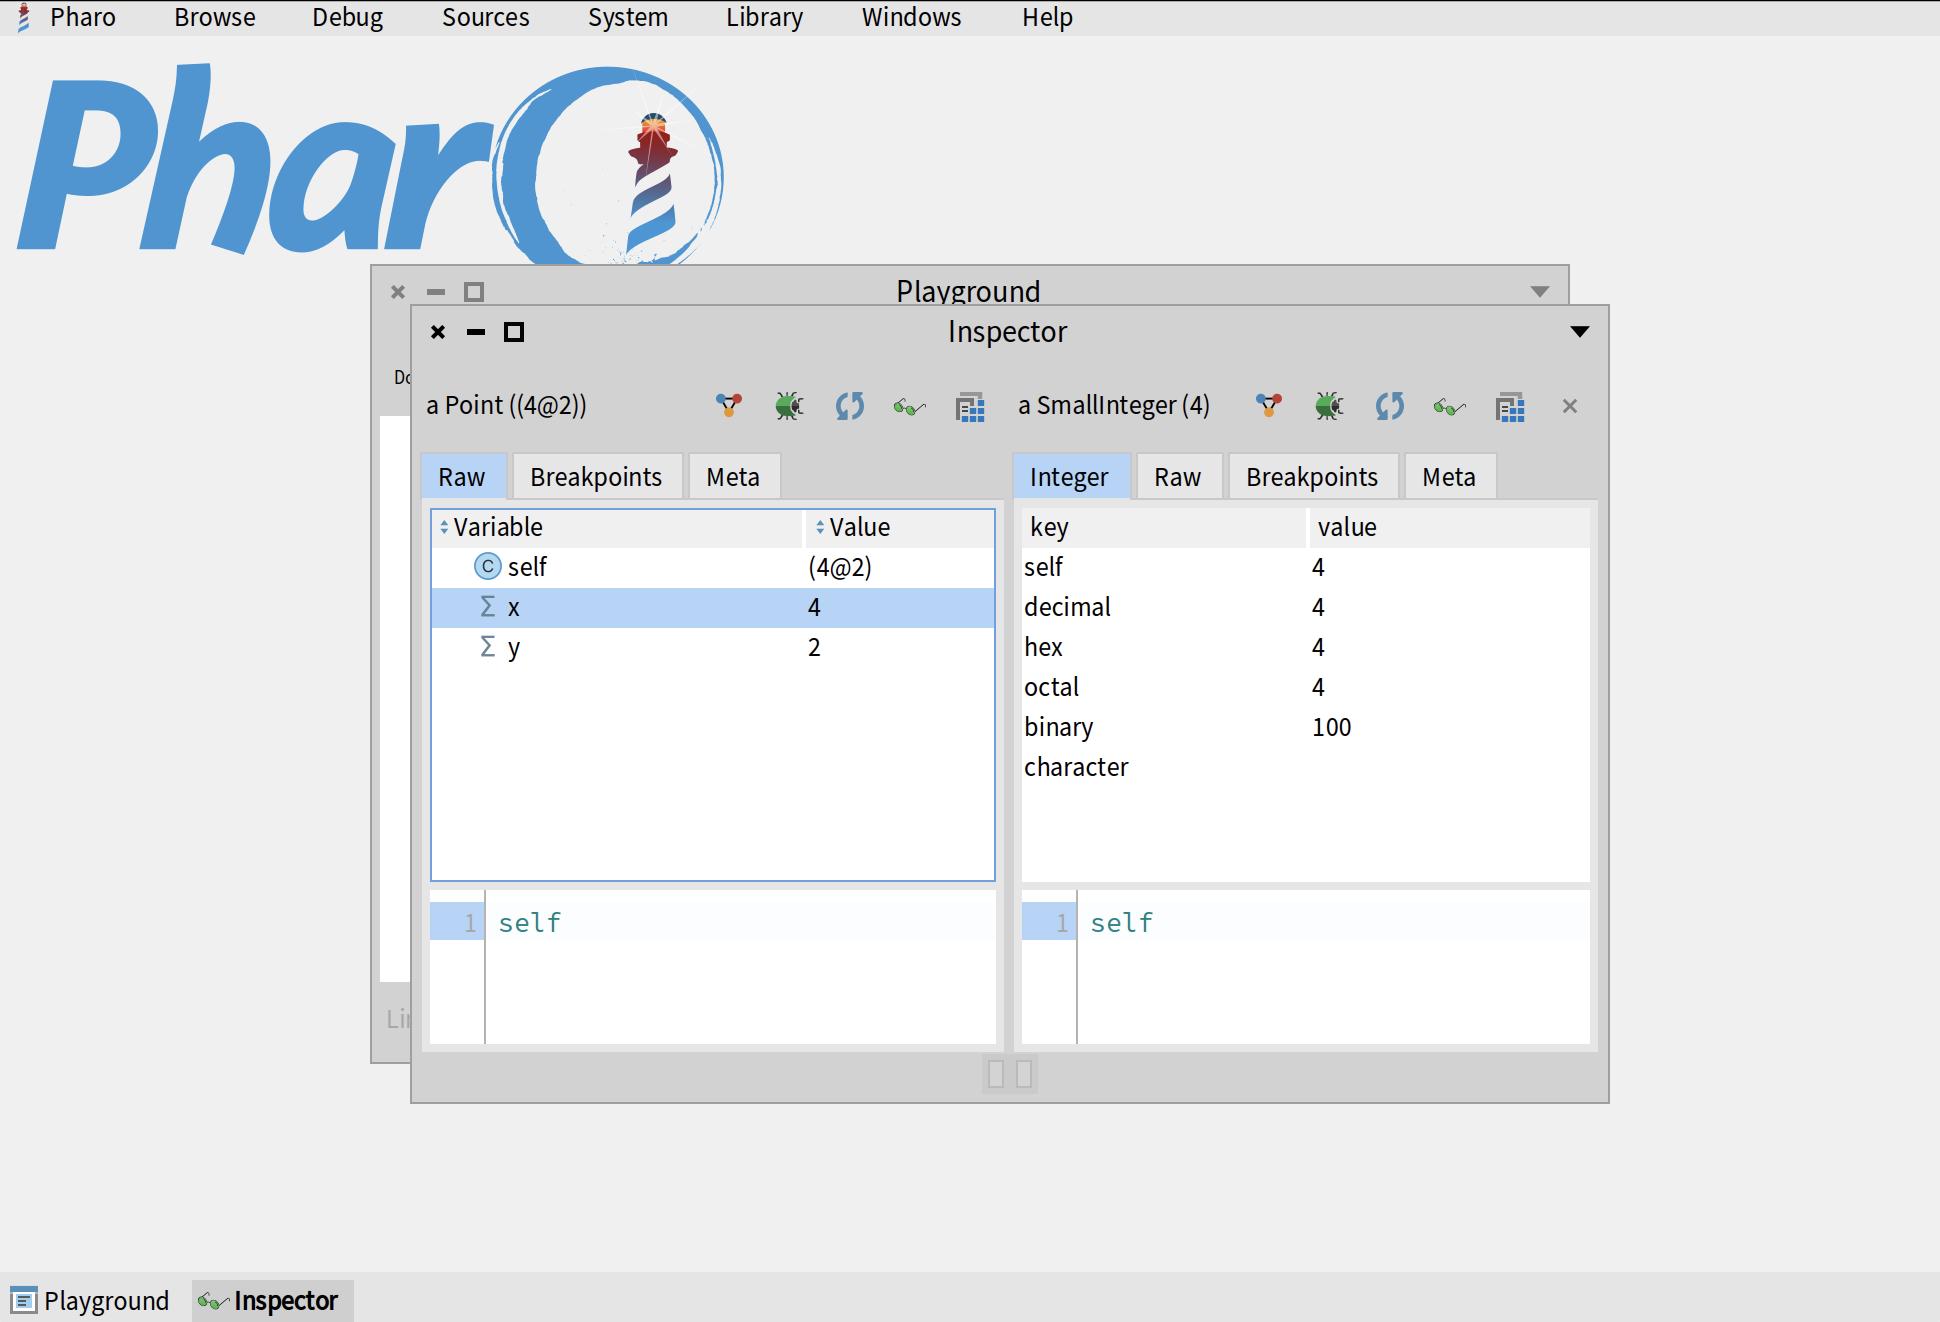
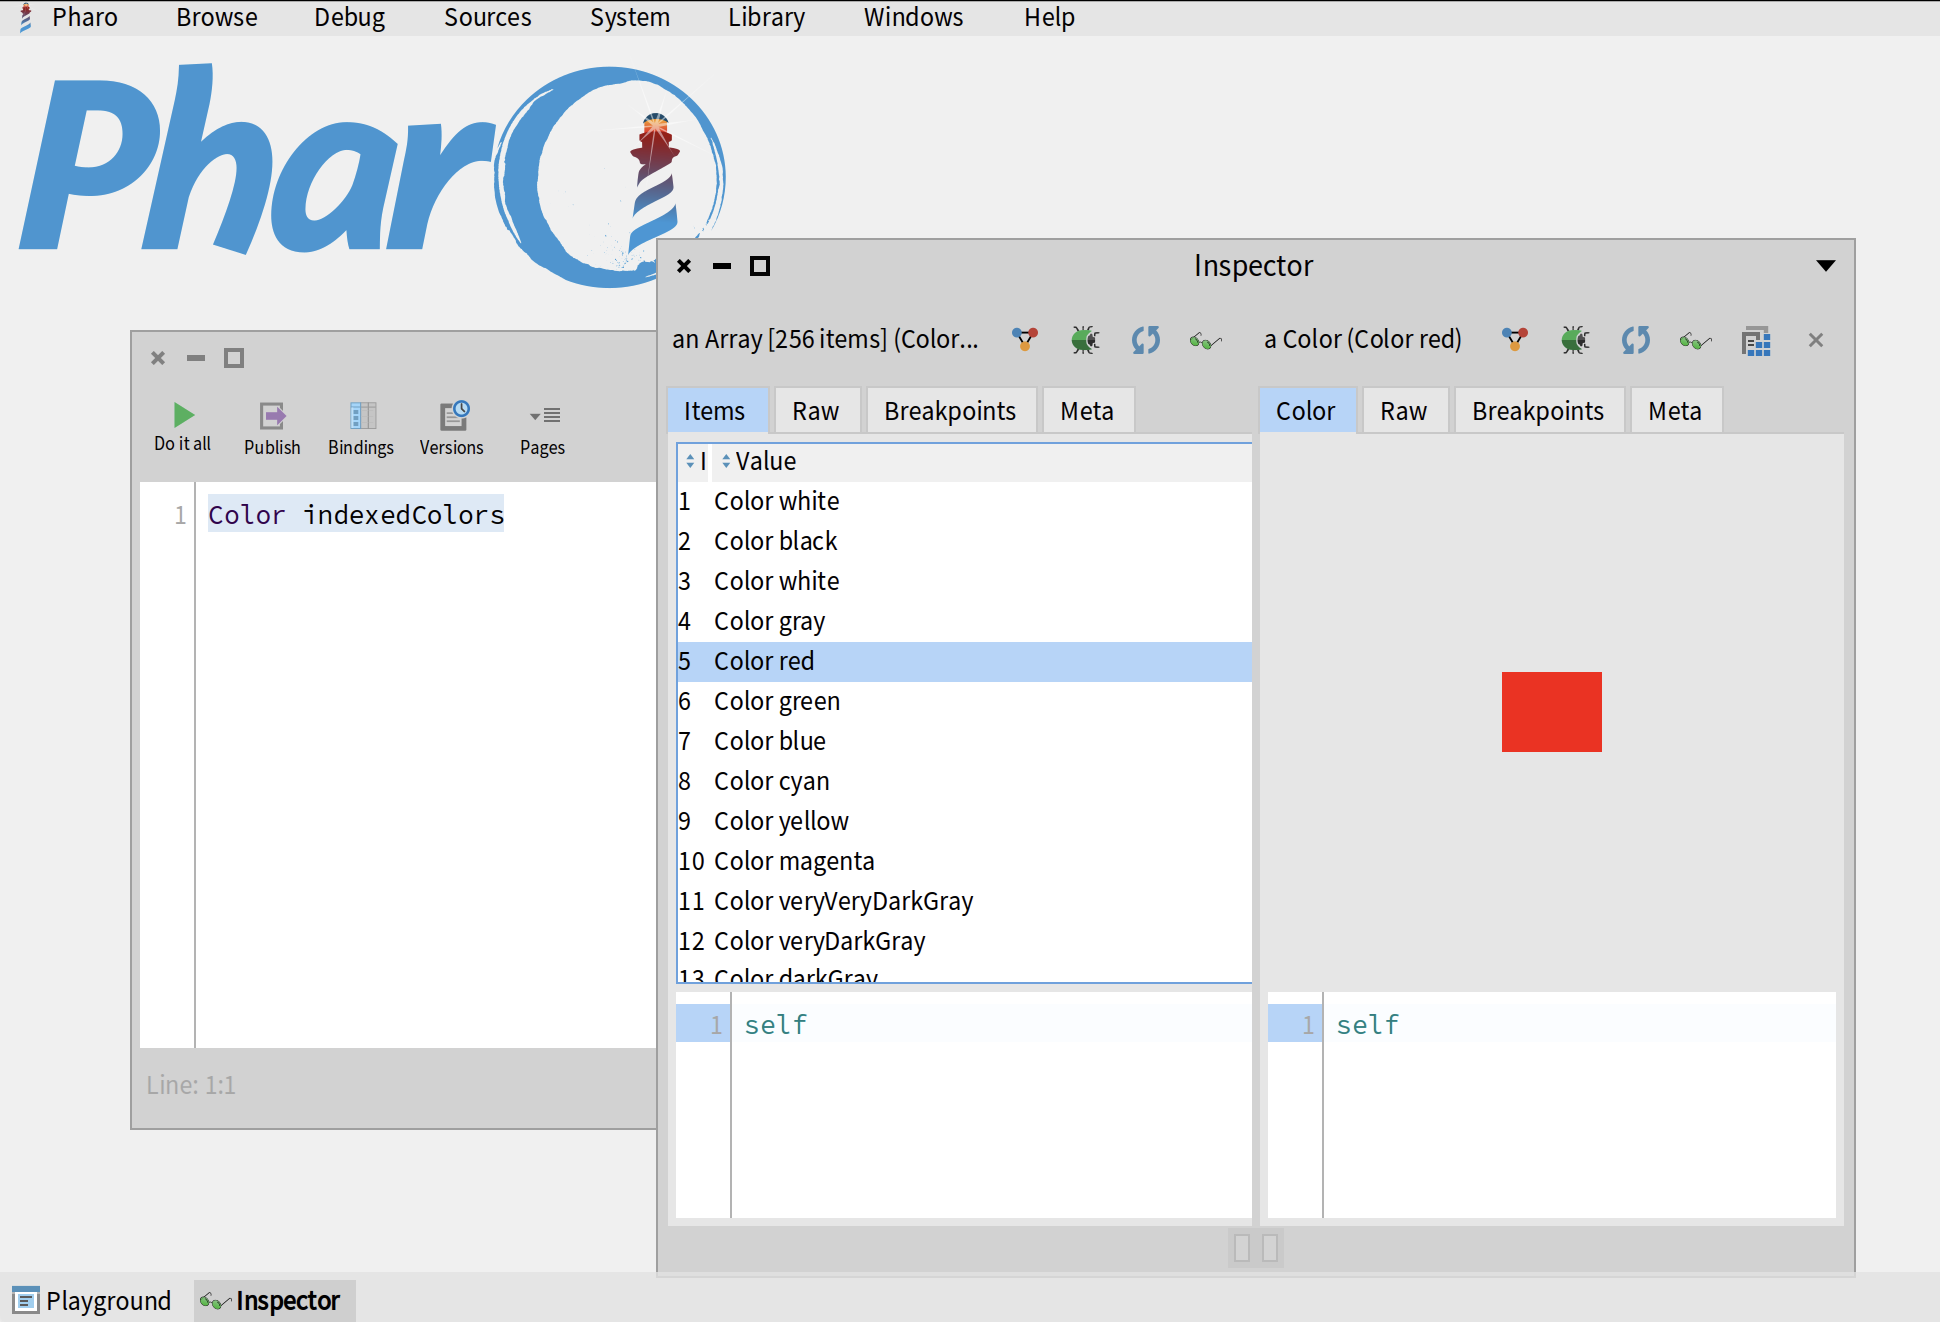
Notice that Smallinteger has a custom inspector tab called Integer which displays different representations of the number: hexadecimal, octal, binary, etc. Every class can define custom inspector tabs for its objects. For example, Color indexedColors returns an array of colors. If you inspect it, you will see a custom inspector tab for Array which displays the list of its elements. If you click on one element, you will see a custom inspector tab for Color which draws a rectangle of a given color.
To learn more about Inspector and to learn how to create custom tabs, read the Inspector article of Pharo Wiki.
Transcript
Transcript is a simple logger that can be used to display string outputs. To open the Transcript window, you can either execute (Do it) Transcript open, click on Browse > Transcript in the World Menu, or ue the keyboard shortcut Ctrl+OT or Cmd+OT on Mac. Once the Transcript window opens, it might already have some logs written in it. If you are using Pharo 13 or later, you can clear your Transcript by clicking on the "Clear" button in the top-left corner. If you are on the earlier version of Pharo, execute Transcript clear in your Playground.
![]()
The simple way to write something on a Transcript is by sending a message show:. You can also send a message cr to create a new line. For example:
Transcript show: 'Hello world!'; cr.
Transcript show: 'Lorem ipsum dolor sit amet'; cr.
A better way of doing so inside a method is by using trace: and traceCr: messages. Why is it better? Because you can override those messages and easily change all the logging in your application (e.g., log to file or disable logging):
foo
	self traceCr: 'Hello world!'.
	self trace: 'Lorem ipsum '.
	slef traceCr: 'dolor sit amet'.
You can also send trace and traceCr messages to strings:
'Hello world!' traceCr.
'Lorem ipsum ' trace.
'dolor sit amet' traceCr.
All the code spippets above produce the same Transcript log.
![]()
It is not a good practice to use Transcript for logging in your application. And even when you use it, there are good and bad ways of doing so. We recommend you to read Transcript: the misunderstood global - a short blog post by Stéphane Ducasse where he explains how not to use Transcript and proposes several alternatives. That being said, even though experienced Pharo programmers don't like Transcript, this tool is still used a by many people, so it's important that you know it.
System Browser
SystemBrowser is arguably the most used tool in Pharo. Generally speaking, this is the tool where we write all of our code - except for those cases when we code inside a debugge - a powerful practice known as eXtreme Test-Driven Development (XTDD).
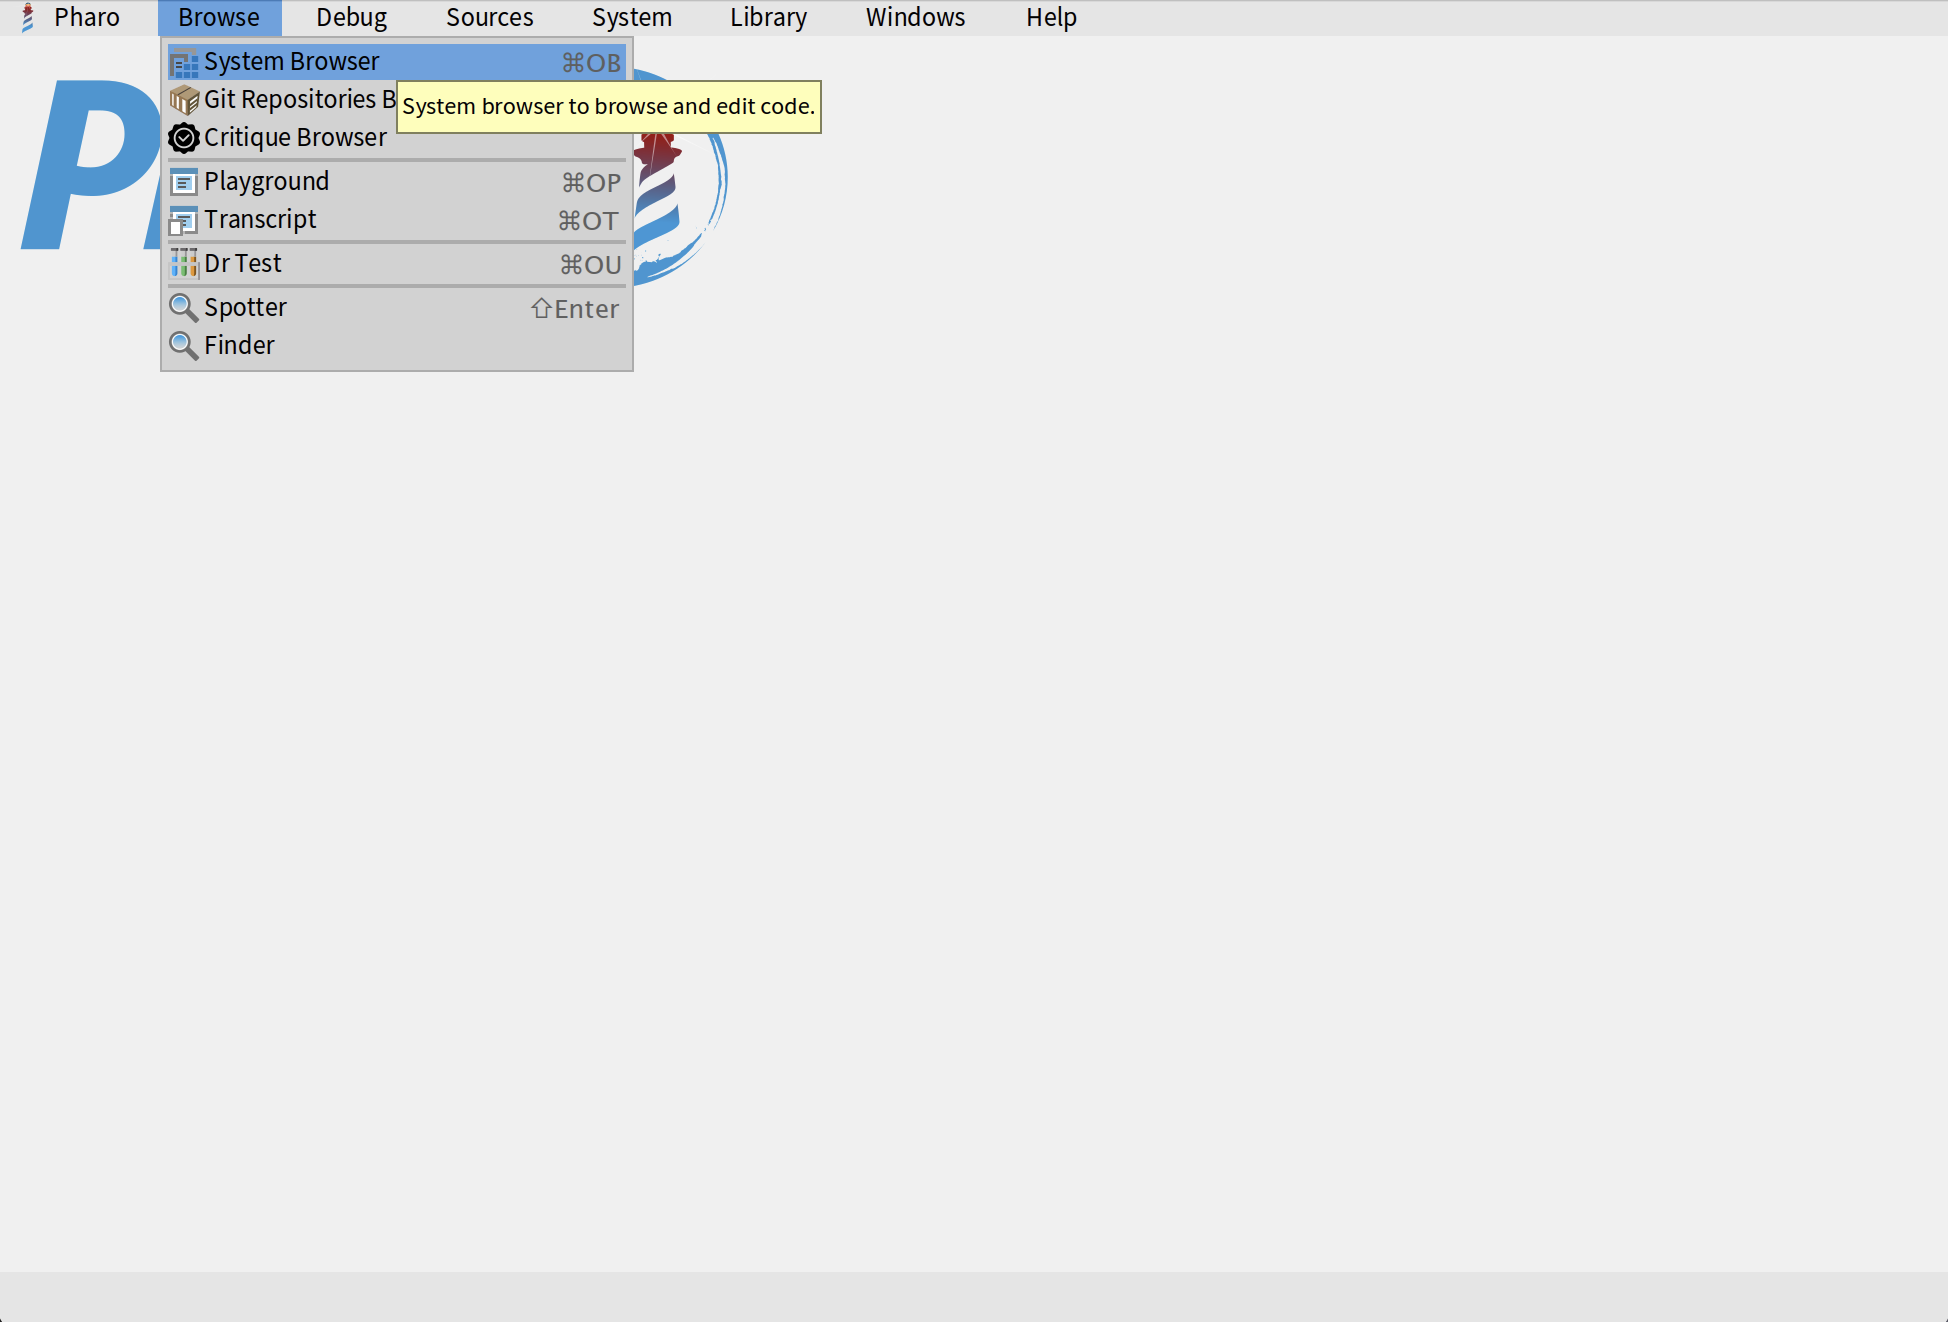
To open SystemBrowser, click on Browse > System Browser in the World Menu. You can also use the keyboard shortcut Ctrl+OB or Cmd+OB on Mac.
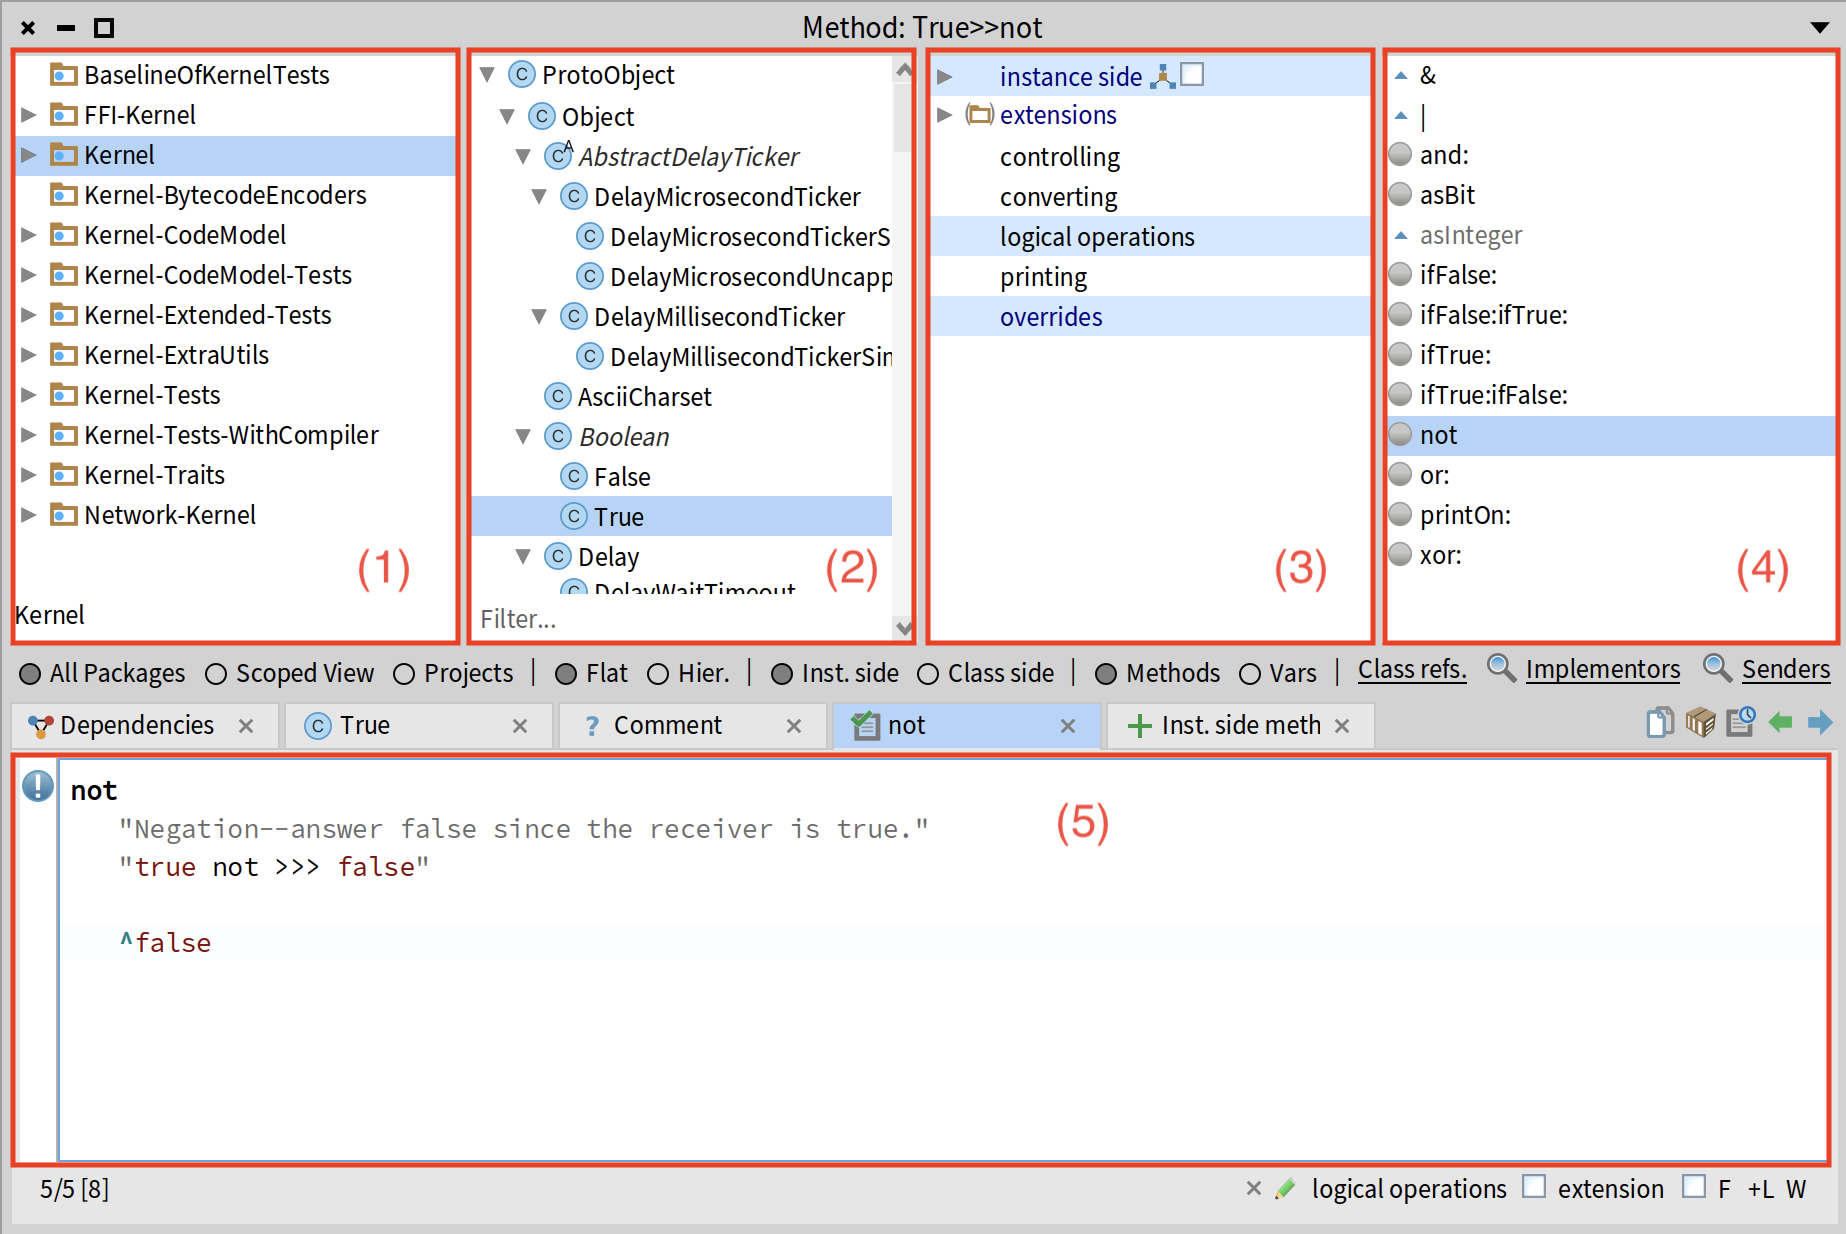
SystemBrowser window conists of 5 main sections:
- Packages - all packages in your image, including those that define Pharo itself: the language, the environment, the graphics - everything is here. Since tere are many packages, you can filter them by name using the text input in the bottom.
- Classes in the selected package.
- Protocols in the selected ckass. Those are just groups of methods that allow us to organize them and quickly navigate large classes.
- Methods in a selected class or protocol. If you click on the class, this section will show all of its methods. If you click on a protocol, you will only see methods from it.
- Source code - if you click on a class, you will see a class definition. If you click on a method, you will see its implementation.
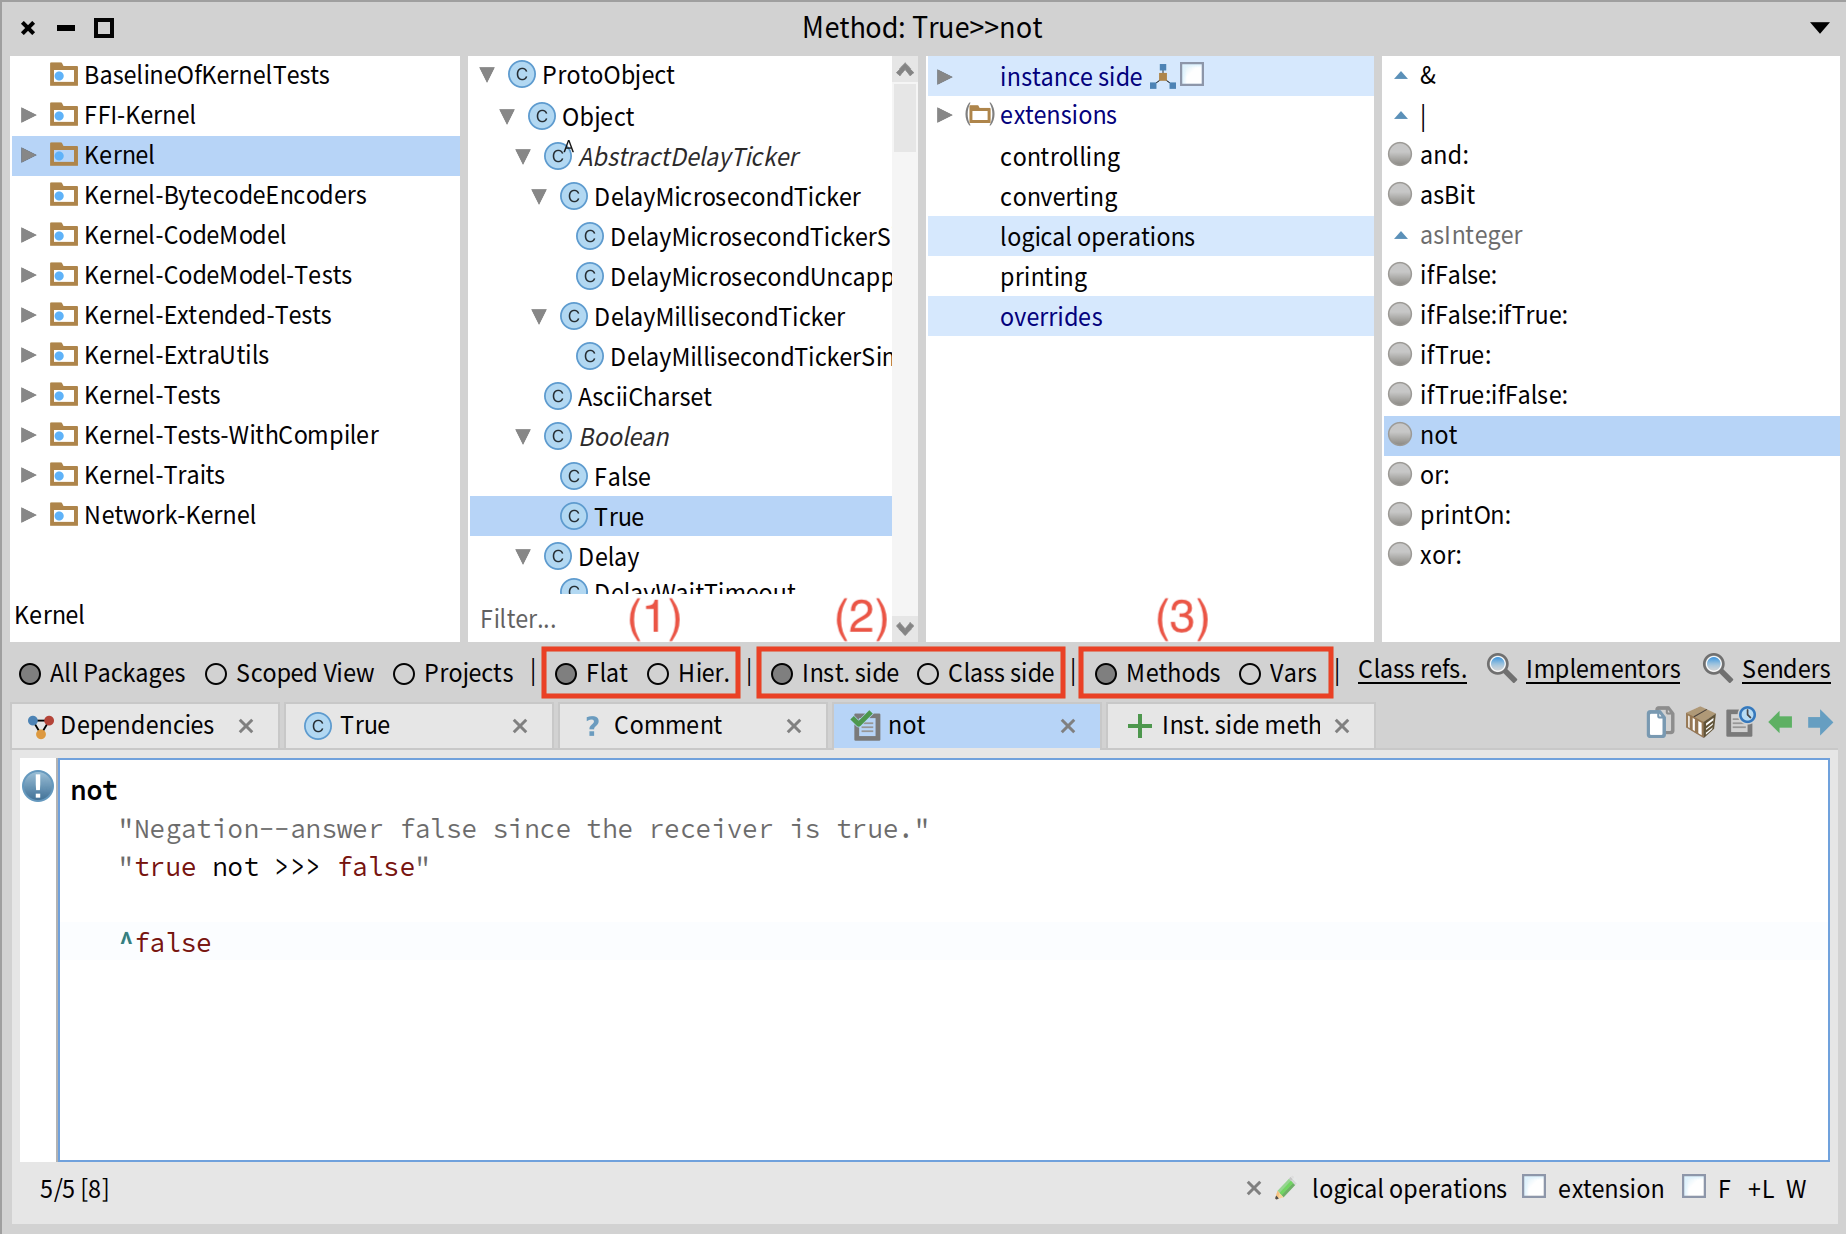
Between the top 4 sections and the code section of SystemBrowser, there are some buttons that allow you to change what is displayed:
- Flat / Hierararchy - switch between the flat view (all classes in the selected package) and hierarchy (all superclasses and subclasses of the selected class).
- Instance side / Class side - switch between instance side and class side variables and methods.
- Methods / Variables - by default, methods are selectedm which means that the third section (described above) contains protocols. If you select "Vars", the third section will display all the variables (instance side or class side depending on what you selected) as well as the variable inherited from superclasses. If you click on a variable, the fourth section will display methods that use the selected variable.
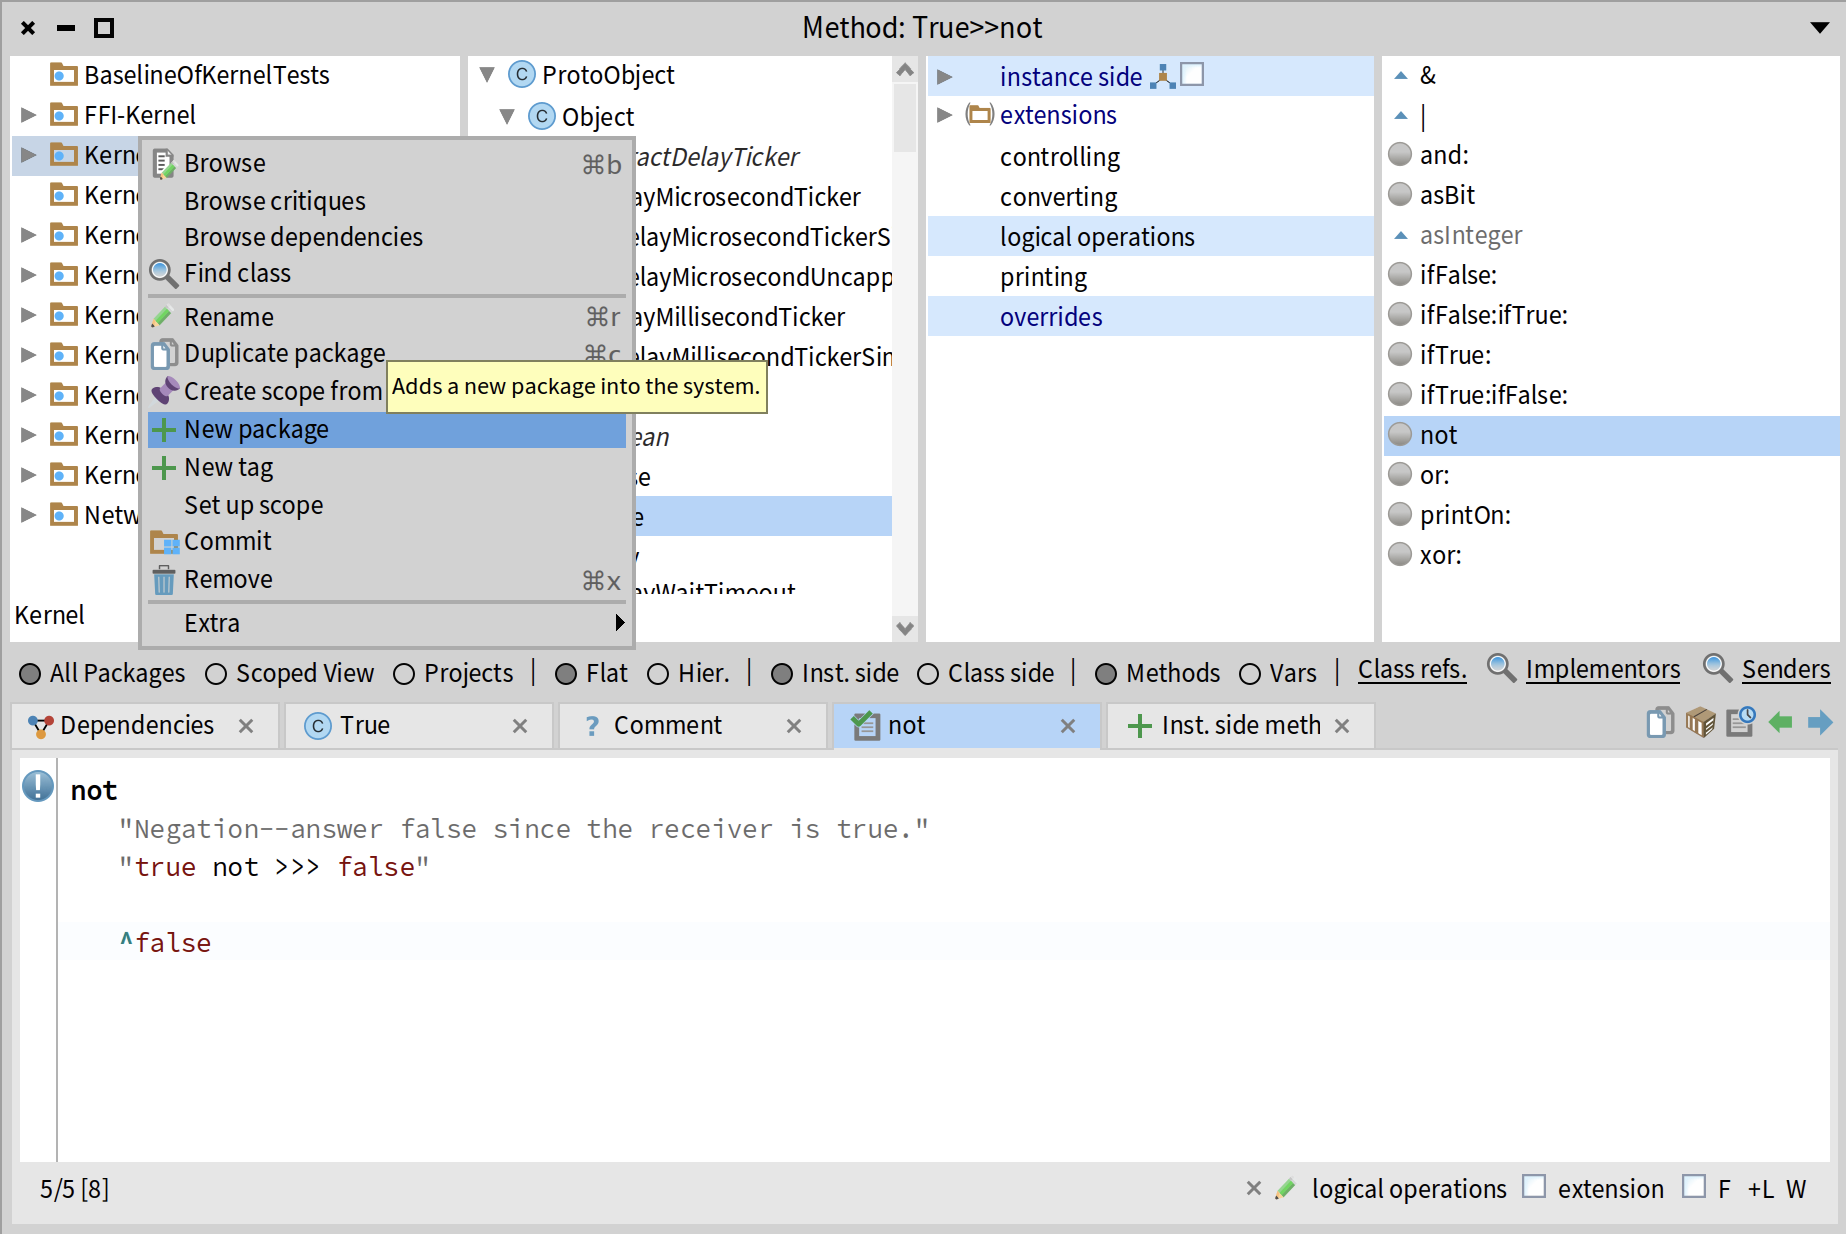
Creating new packages, classes, and methods
To create a new package in a SystemBrowser, right-click on any existing package and select "New package" from the menu. Type the name of your package in the dialog window and click "OK". In this example, I create a package called "Bookstore".
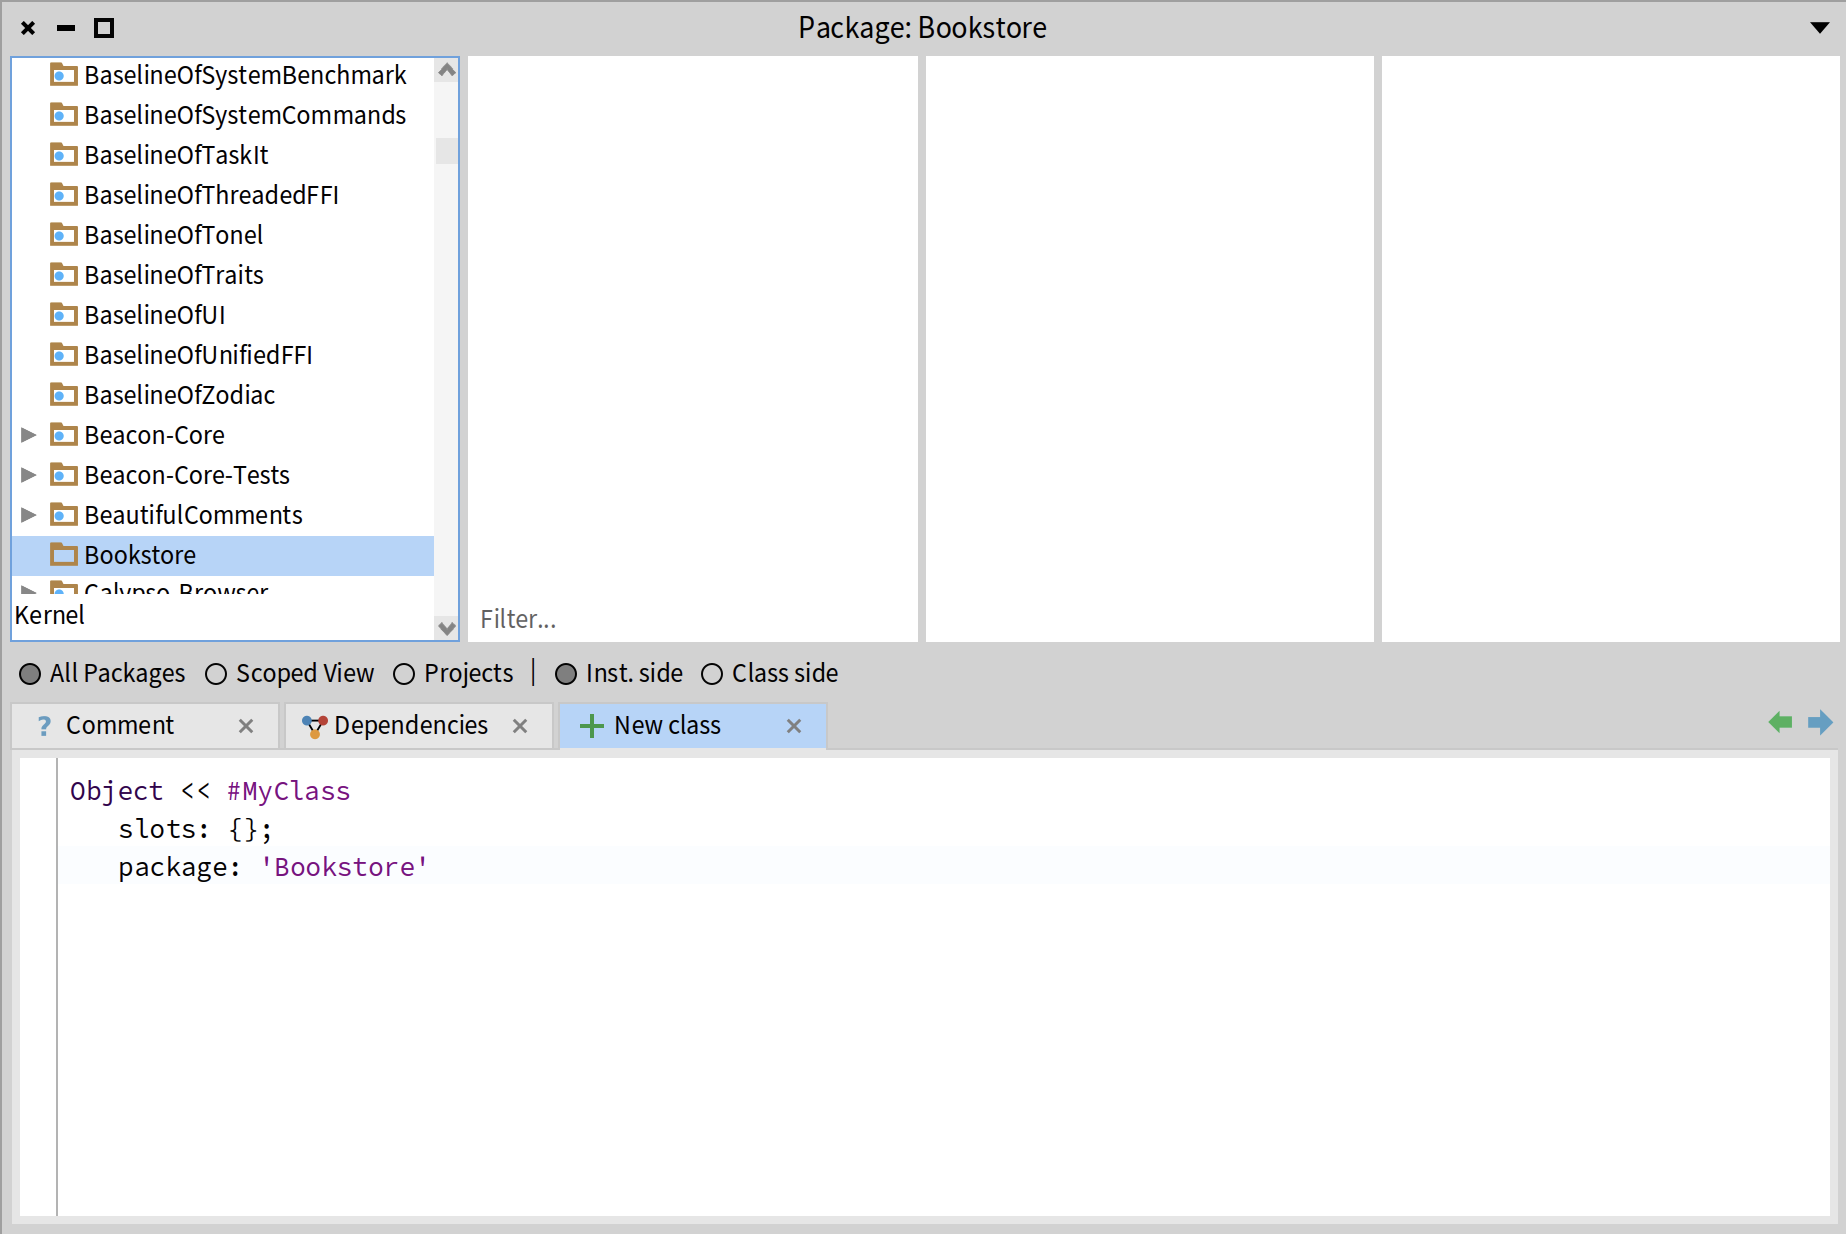
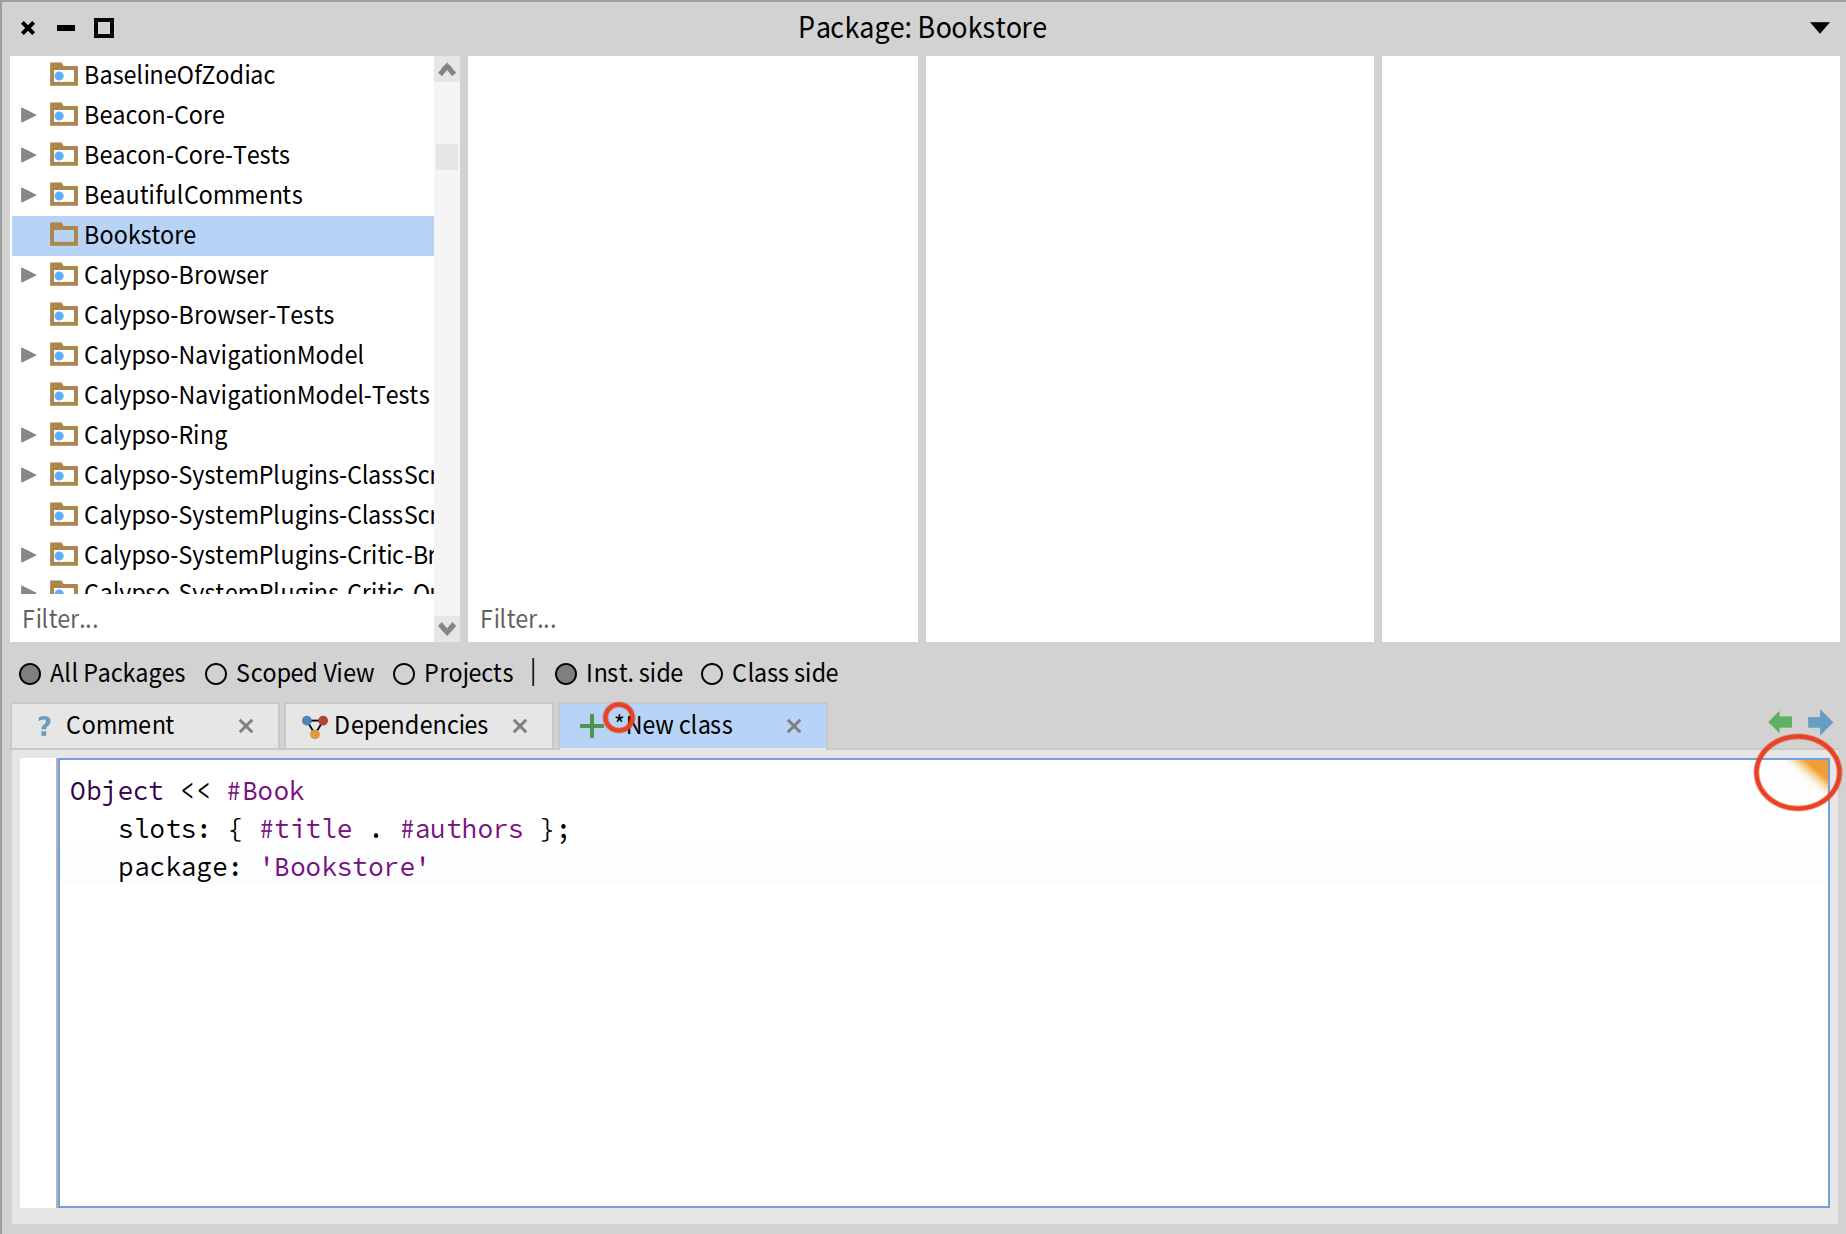
To create new class in an empty package, simply click on the "New class" tab in the code section. You will get a default template of a class definition. Here Object is a superclass. #MyClass is the name of your class (pay attention that there it starts with a # because it is a Symbol). slots: accepts an array of instance variables. In the default template, this list is empty.
In this example, I create a class Book which is a subclass of Object and has two instance variables: #title and #author (both variable names are Symbols, so they also start with a #). When you change anything in the code section, you will see a little orange triangle in the top-right corner and an asterisk (*) at the beginning of the tab name. Those indicate that your changes were not saved. To save your changes, click Ctrl+S on Windows or Linux or Cmd+S on Mac. You can also right-click anywhere in the code section and select "Accept" in the bottom of the menu.
Don't forget to save your code every time you modify a method implementation or class definition. You can do so with Ctrl+S on Windows or Linux or Cmd+S on Mac.
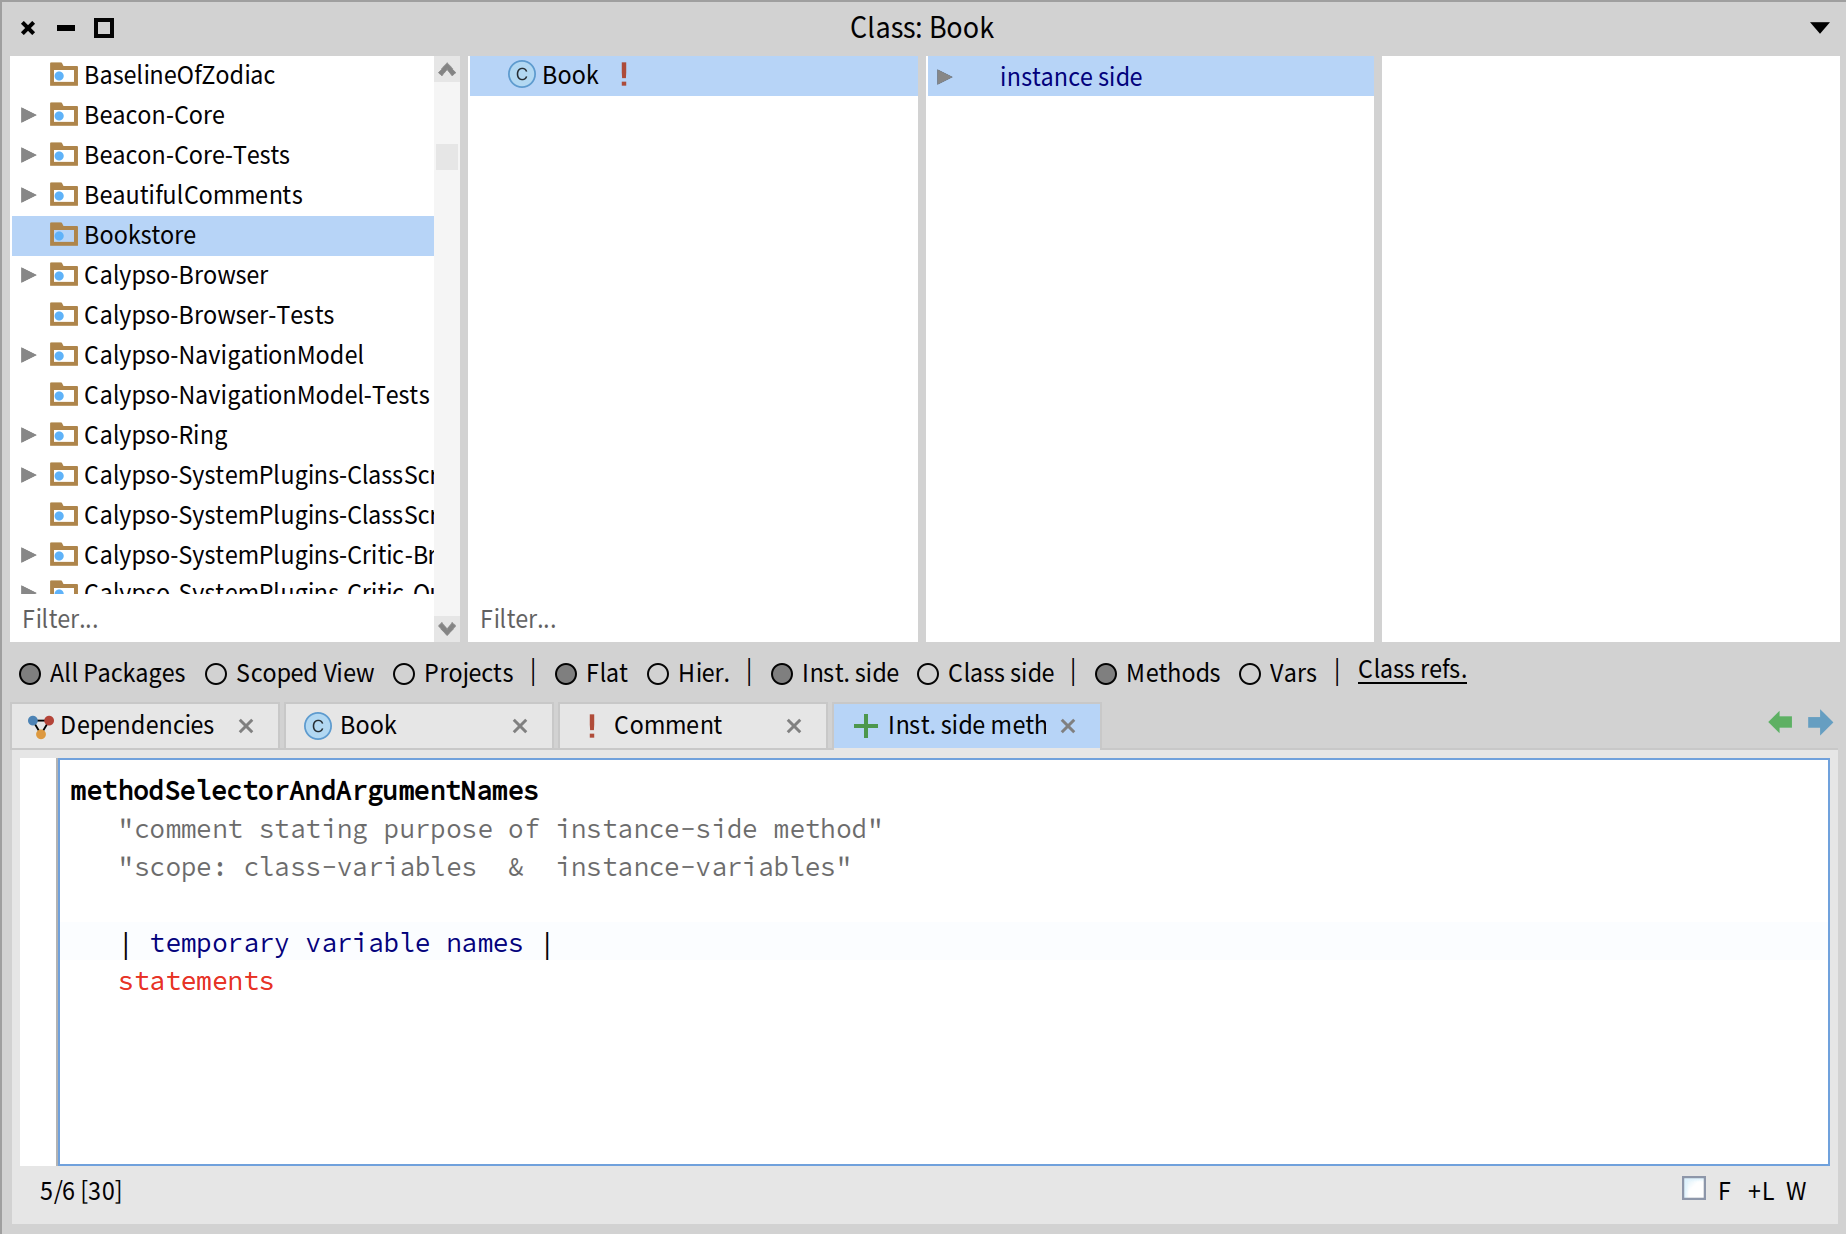
To add a new instance side method, click on your class in the top part of the SystemBrowser, then click on the "instance side" in the protocols section. The method template will appear in the code section. It will contain a method name (called methodSelectorAndArgumentNames), a comment, some temporary variable names, and a placeholder for statements.
Feel free to delete everything and start typing. The first line will be the name of your method (including the argument names). In this example, I will create a method title: which takes one argument called aString and assigns this value to the title variable. Don't forget to save your code after you have typed it.
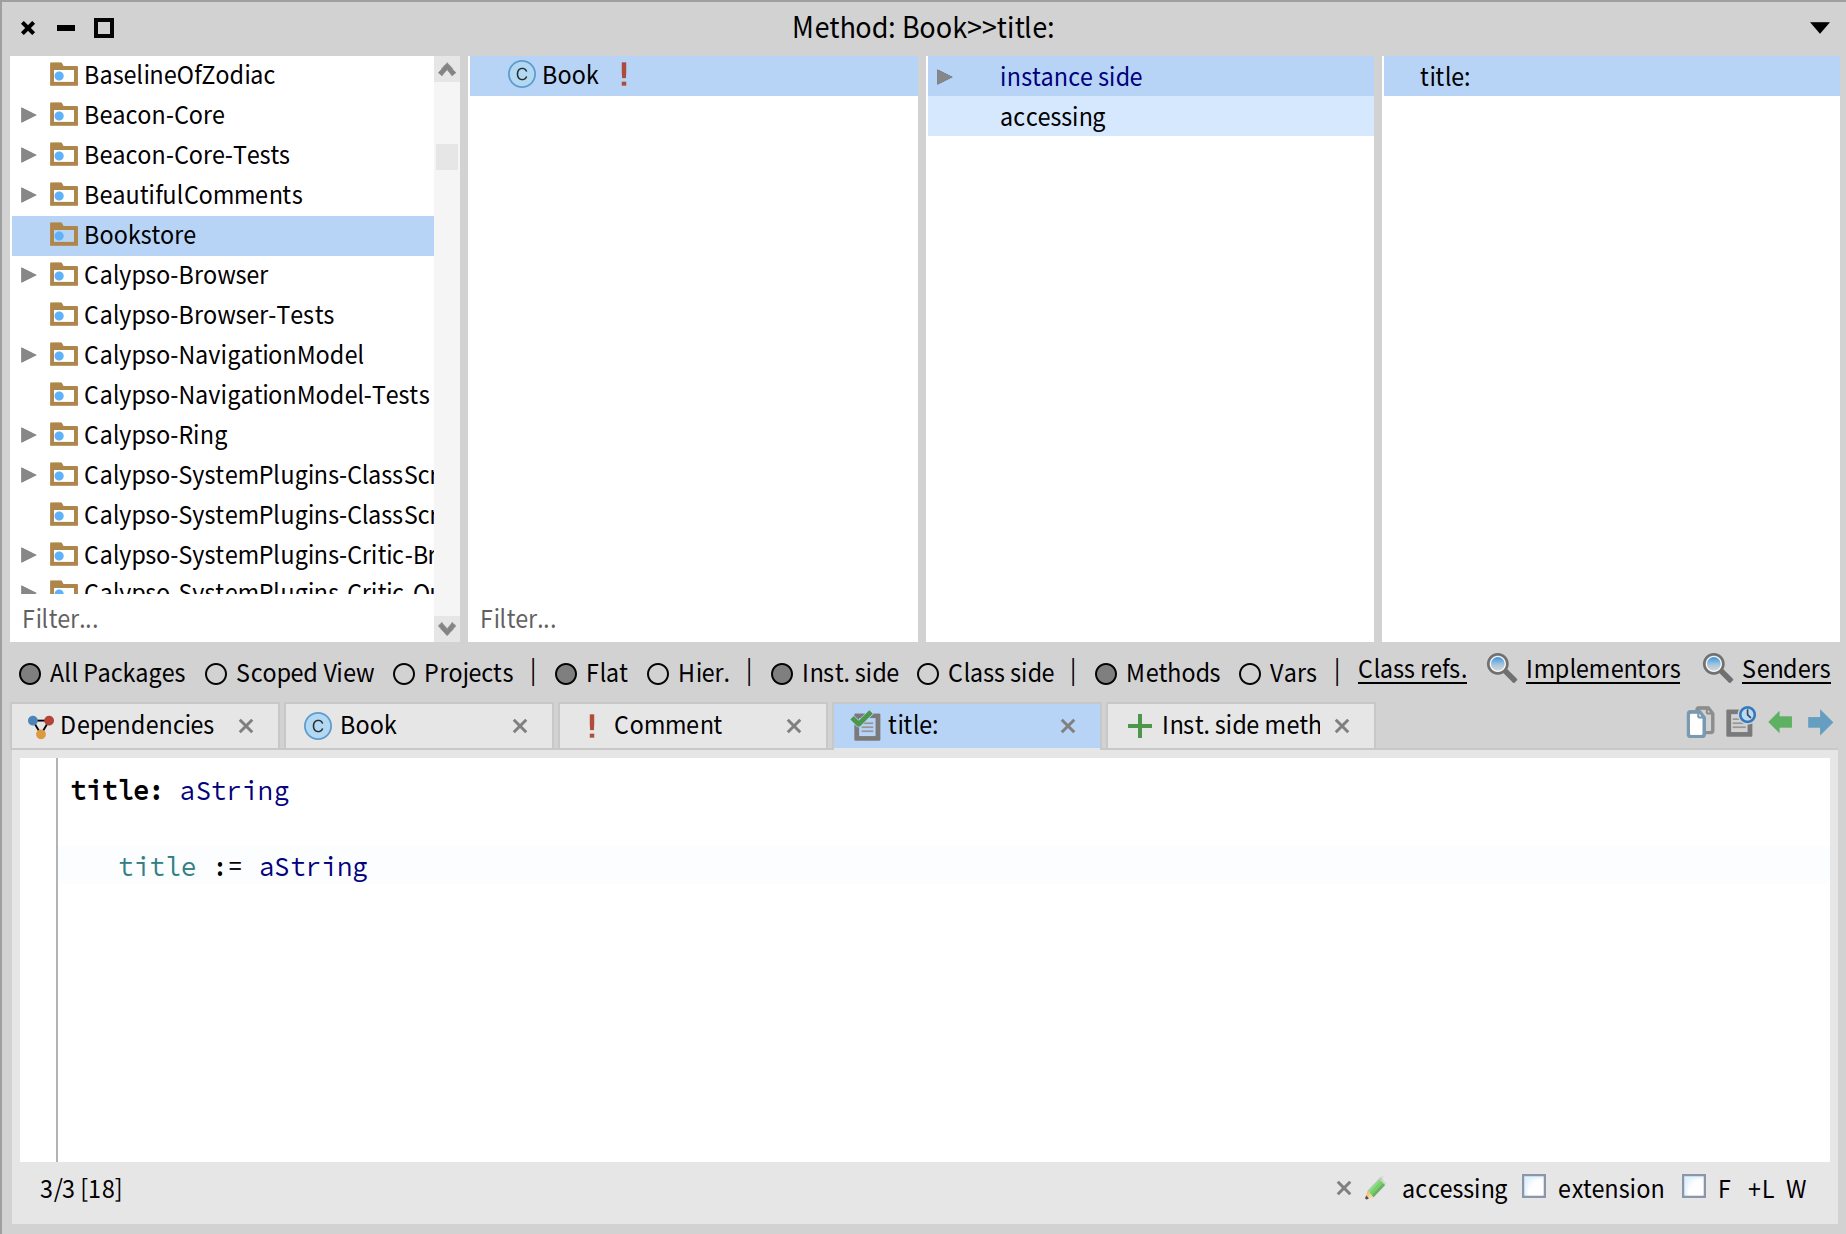
Pharo is smart, so it recognizes that my new method is an accessor and automatically classifies it into the accessing protocol. If you want to add a new protoccol, right-click anywhere in the protocols section, and select "New protocol" in the menu. You can either select one of the existing protocols from the list or type a new protocol name and click "OK". Once your new protocol has been added, you can drag-n-drop your method into it.
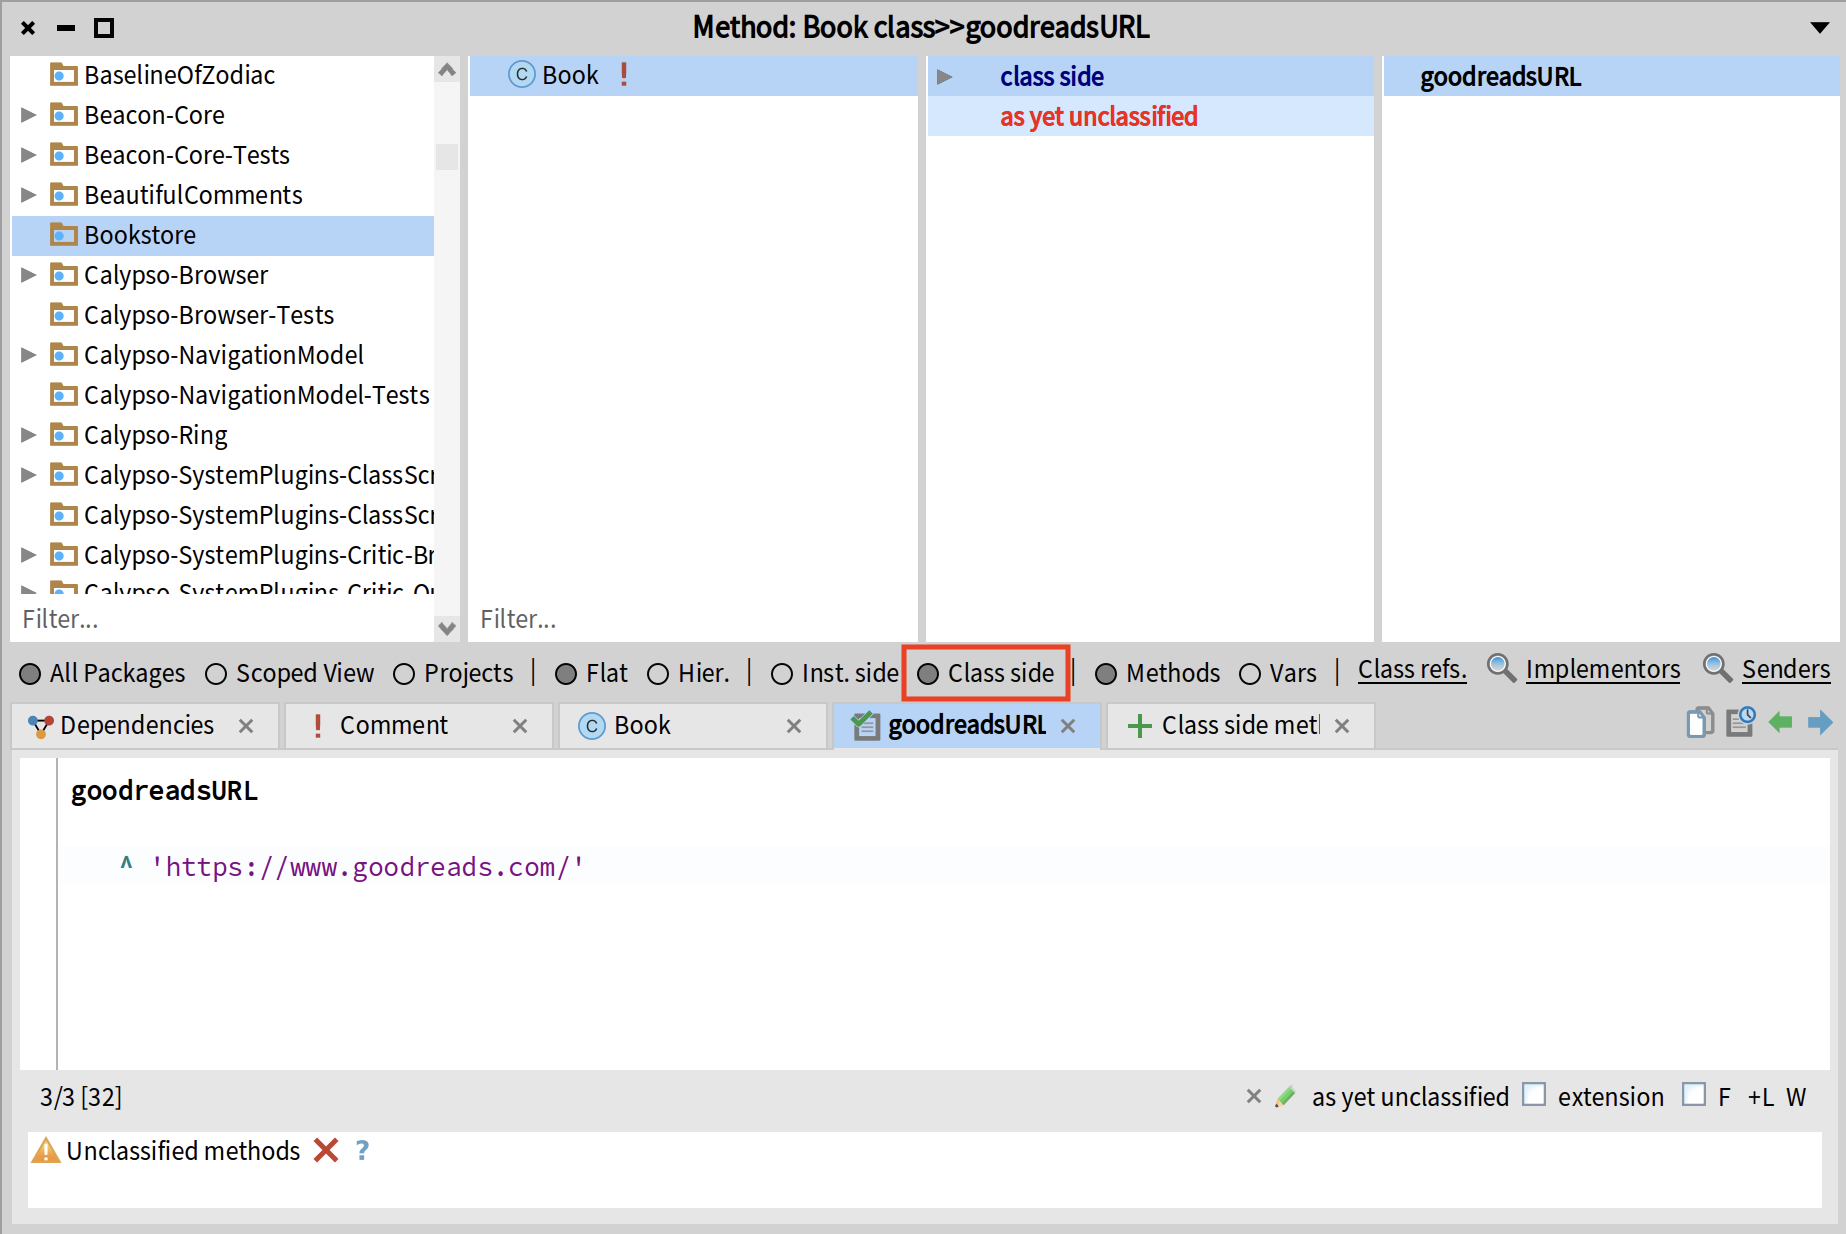
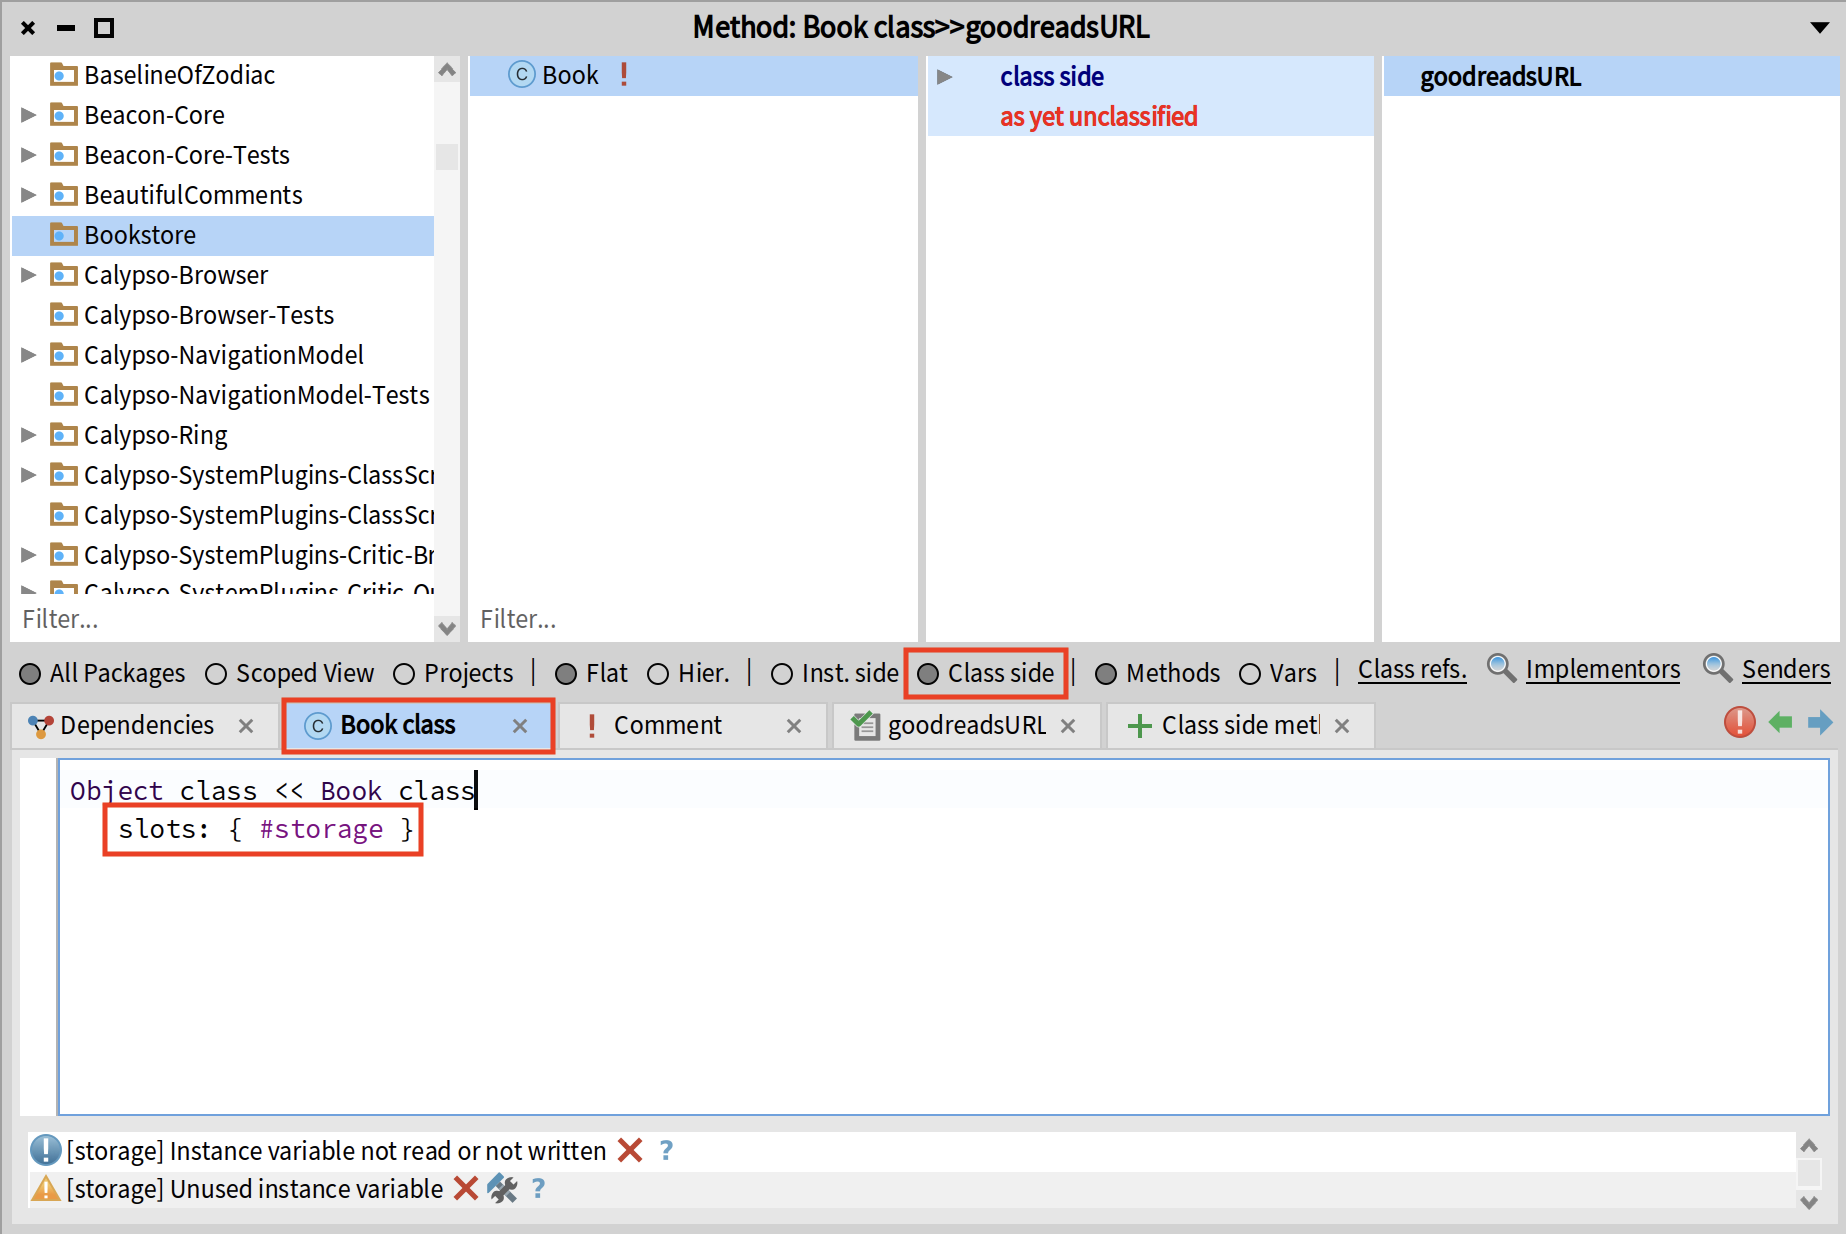
To add a new class side method, click on te "Class side" button, then click on the "class side" in the protocols section and repeat the same process as for the instance side. In this example, I will add a class side method that returns a String with a URL to goodreads.com.
You can also add class side variables by switching to the class side view and modifying the class definition. In this example, I will add a class side varible called storage.
You can add more classes and methods, by simply modifying the code of the existing ones. As soon as you change the name and save it, a new class or method will be added.
Debugger
Spotter
Finder
Browse Implementors
Each message in Pharo can have many different implemenators (methods that implement it). Consider the following code:
left or: right
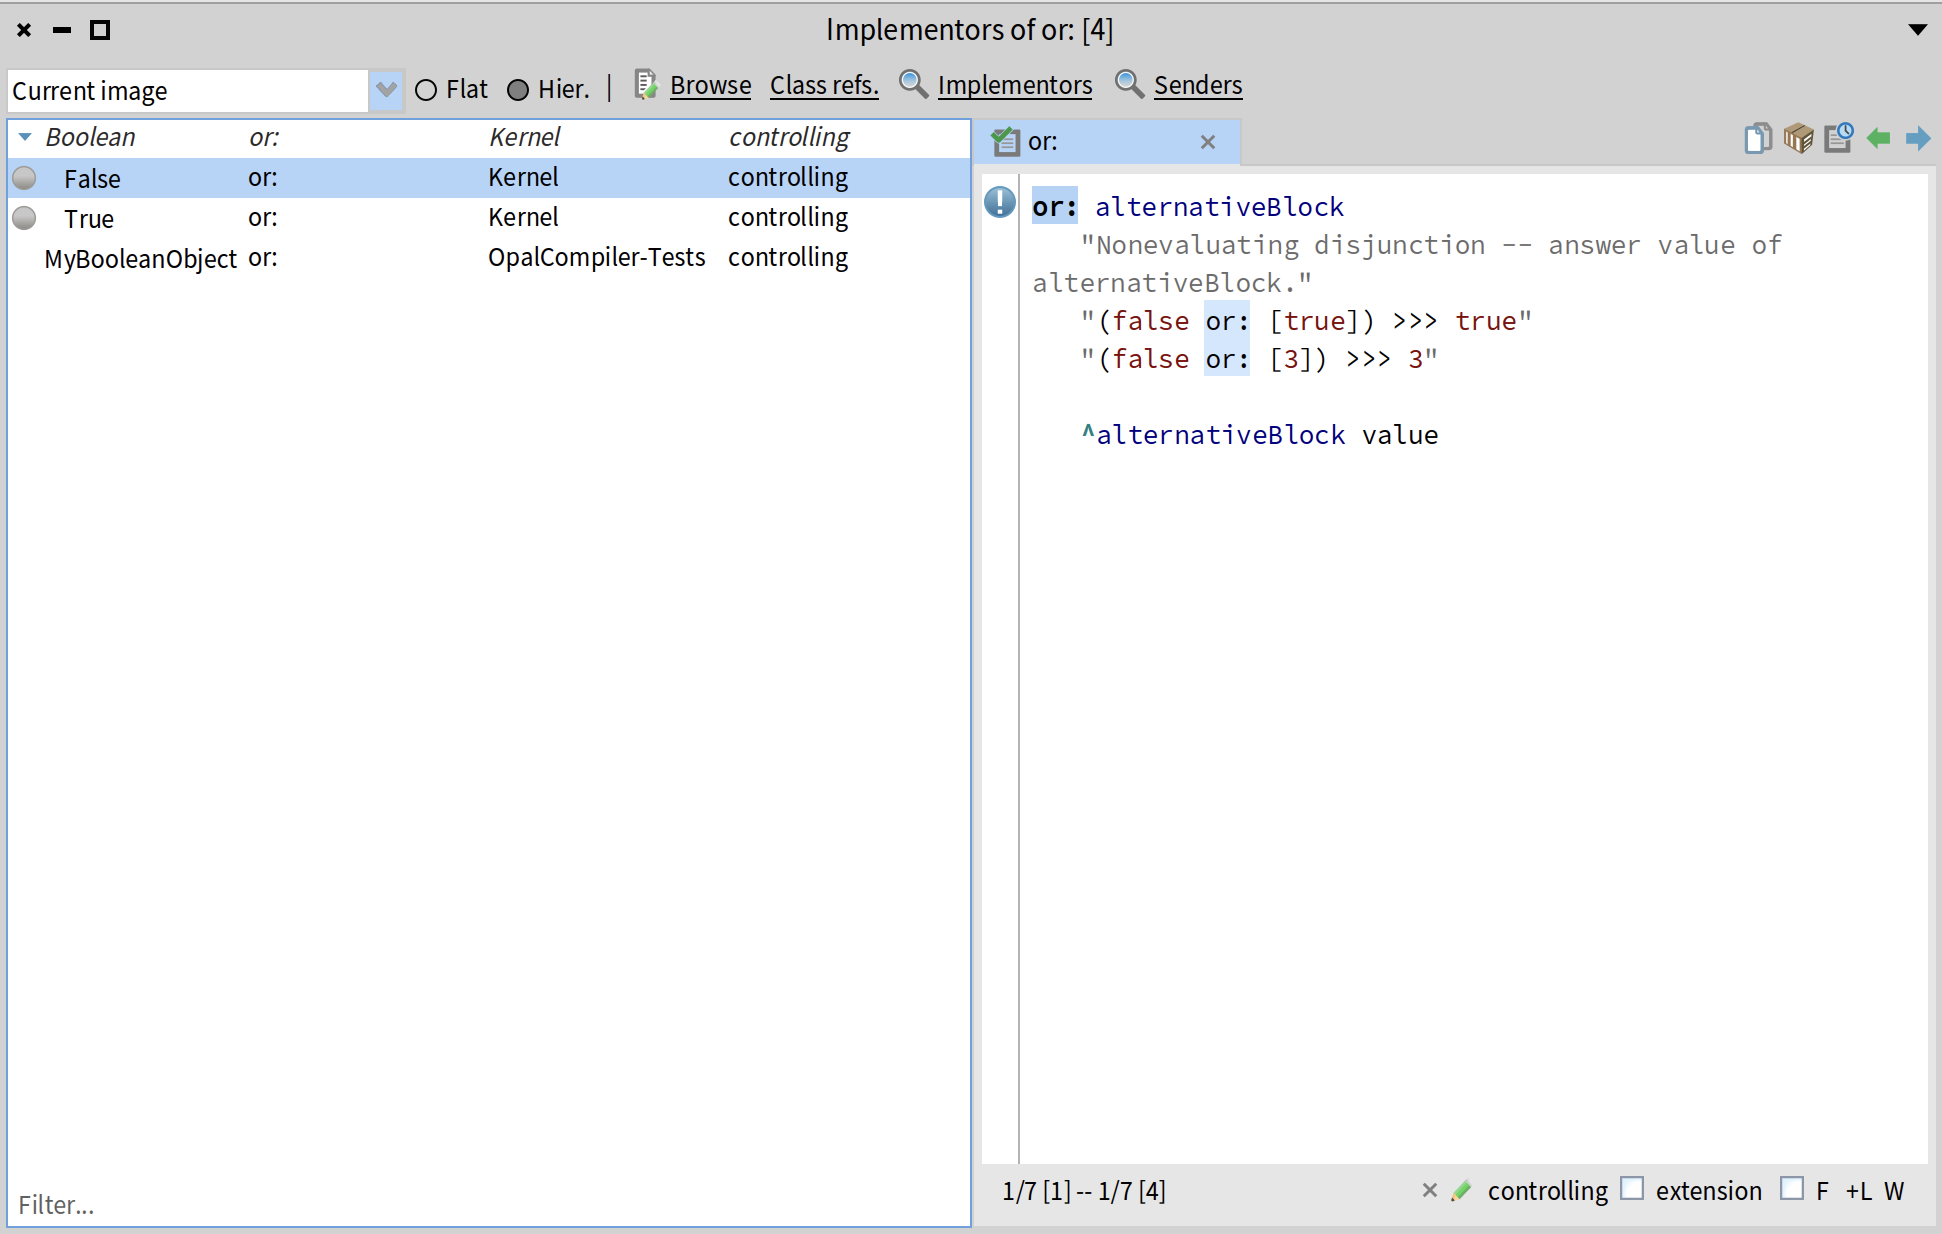
or: is a keyword message that is sent to the receiver left with one argumnent right. Which method will be executed as a result of this message send? This depends on the class of the receiver left. If left is true (instance of class True), it will execute the method True >> or:, if it is false (instance of class False), the method that will be executed is False >> or:.
We can check all implementors of a given message by positioning our cursor on it and pressing "Ctrl+M" (or "Cmd+M" on Mac). This will show us all the methods that implement or: in our image (all methods named or:).
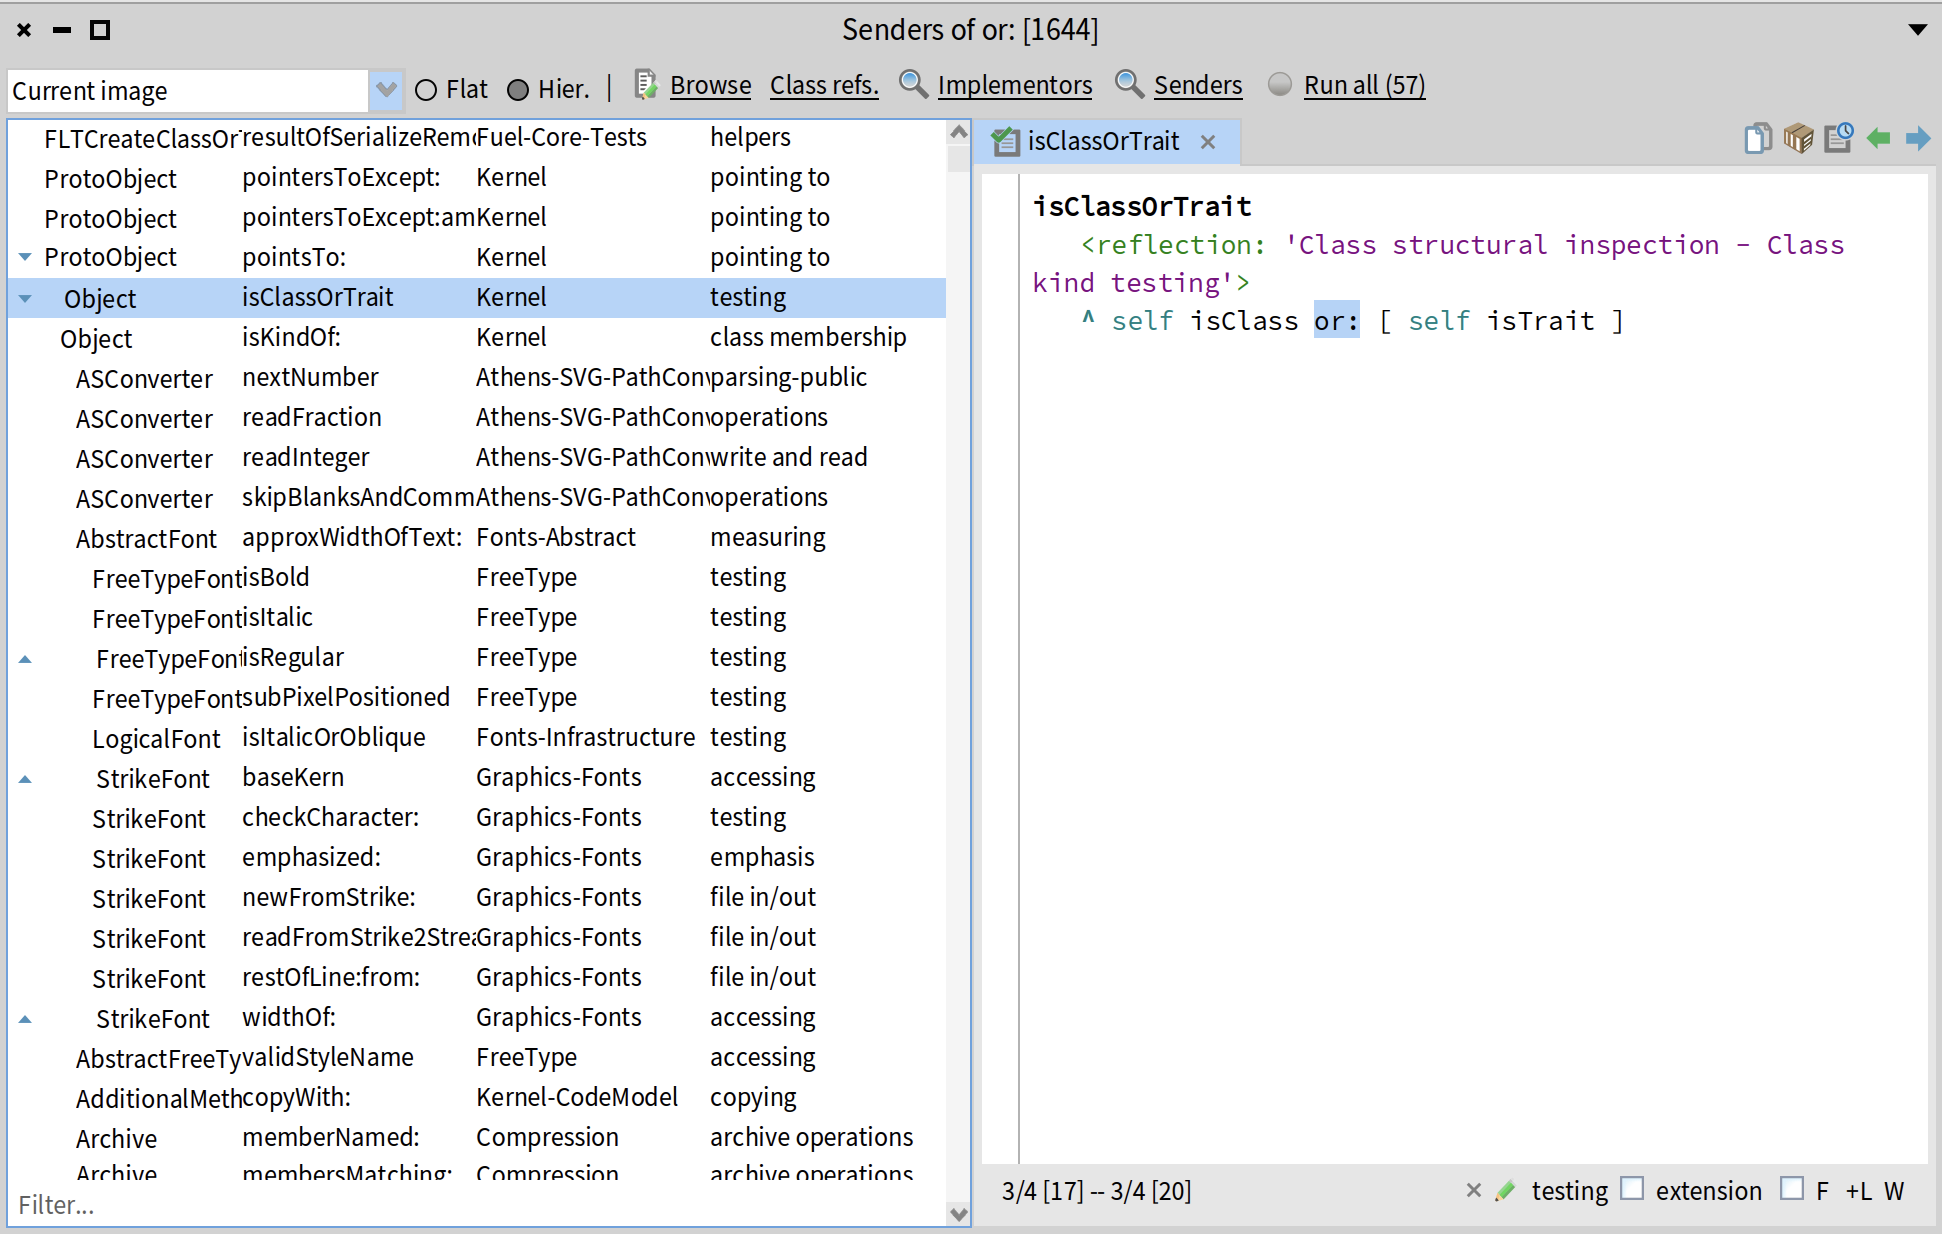
Browse Senders
Another useful shortcut is to browse all senders of a message - all places in the source code of the whole image where a given message is sent (where one of the methods with a given name is called).
To browse all senders, place your cursor at the message in the code and press "Ctrl+N" (or "Cmd+N" on Mac). This will show all methods that send a given message. Remember that since a message can have many implementations, we might not always be sure which method will be executed (in fact, this is the whole point oof polymorphism and the key to object-oriented programming).